
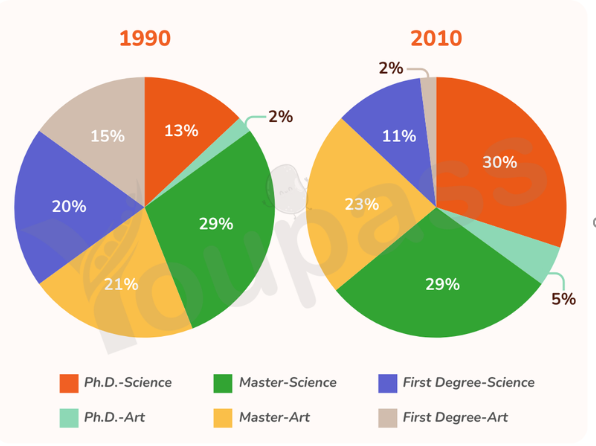
The two pie charts illustrate the qualified levels of staff in an advertising company between 1990 and 2010. Overall, it is clear that there was an upward trend in the percentage of staff who had Master arts, Ph.D arts and Ph.D science qualifications while the trend for the rest of education levels of officers saw the opposite side. In addition, Ph.D science witnessed the most significant increase over the ten-year period. In 1990, the proportion of Master science staff made up the highest point, at 29%, the figures for First degree science and Master arts were nearly similar rate at 20%. Besides, First degree arts and Ph.D science constituted slightly lower rate at 15% and 13% respectively. The lowest figure can be seen in the pie chart was Ph.D arts at 2%. In 2010, the proportion of Ph.D science employee rose dramatically and peaked at the pie chart while the percentage of Master science staff remained unchanged at 29%. Master arts had a slightly increase by 2%. By contrast, First degree science and First degree arts experienced a sharp fall by 9% and 13% respectively. The lowest proportion of educational levels of staff was from Ph.D arts, which increased 3% in 2010.
Detail Sampel
The charts below show the qualifications of staff in an advertising company in 1990 and 2010. Summarise the information by selecting and reporting the main features, and make comparisons
22/07/2026 06:33 7.0 skor
Topik
The charts below show the qualifications of staff in an advertising company in 1990 and 2010. Summarise the information by selecting and reporting the main features, and make comparisons
Jumlah kata: 202
Grafik/Diagram
Essay
Skor Keseluruhan
7.0±0.5
Baik
Skor Kriteria Writing
TA7.0
CC7.0
LR7.0
GRA7.0
Klik teks yang ditandai di esai untuk melihat saran detail untuk peningkatan.
Analisis mendalam
Task 1 - Academic Writing
4 tools available
Esai contoh - IELTS Writing Task 1
Belum ada esai contoh
Silakan klik tombol di bawah untuk menganalisis dan membuat esai contoh berkualitas tinggi untuk Task 1.