
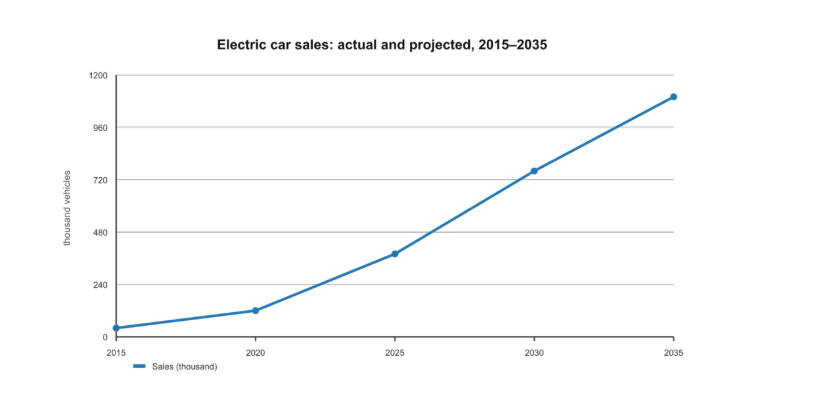
The line graph illustrates the sales of electric cars and its projection in country D between 2015 and 2035. Overall, the sales show a consistent upward trend throughout the period .While the growth was steady in the intial years, it is projected to accelerate significantly toward the end of the period, with the sales are expected to surpass one million in 2035. In 2015, the number of cars using electricity energy stood at 50 thousand vehicles before doubling to 120 thousand five years later. The rate of growth continued, with the figure increased to 380 thousand in 2025, which represented a significant increase of 260 thousand compared to the 2020 figure. From 2030 onwards, the growth rate of electric vehicles sales is expected to be intensify further. The number is forecast to reach 760 thousand in 2030. In the final 5 year period, The sale is projected to achieve the peak at 1100 thousand vehicles, This figure represents a massive leap from the intial figure of 50 thousand vehicles recorded at the start of the period.
Sample Detail
The line graph shows actual and projected sales of electric cars in Country D from 2015 to 2035.
22/07/2026 06:40 6.5 points
Topic
The line graph shows actual and projected sales of electric cars in Country D from 2015 to 2035.
Word count: 176
Chart/Graph
Essay
Overall Scores
6.5±0.5
Fair
Writing Criteria Scores
TA7.0
CC7.0
LR6.0
GRA6.0
Click on any highlighted text in the essay to view detailed suggestions for improvement.
Deep Analysis
Task 1 - Academic Writing
4 tools available
Sample Essay - IELTS Writing Task 1
No sample essay
Click the button below to analyze and generate a high-quality sample essay for Task 1.