
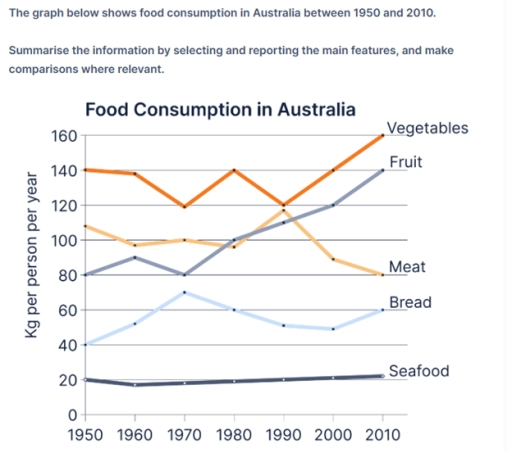
The line graph illustrates the amount of food consumed per year in Australia in 60 years period, starting in 1950. Overall, it can be seen that vegetables accounted for the largest food consumption in Australia over the period, despite a fluctuation halfway through the period. On the other hand, the amount of fruit consumed showed an upward trend, and overtook that of meat twice. Additionally, the figure for bread consumption increased, while seafood remained the lowest figure. The figure for vegetables started at approximately 140kg per person per year at the beginning of the period. After that, this figure fluctuated between 120kg and 140kg in 1960 and 1990, after which this figure steadily rose to 160kg of vegetables consumed per person. Regarding meat, individuals consumed 110kg of meat per year in 1950, followed by an increase to 120kg by 1990. This figure then declined over the rest of the period, at only 80kg. The amount of fruit consumed in 1950 was 80kg, later the figure overtook that of meat twice in 1980 and 1990, and became the second most food consumed in Australia. The figure for bread started at 40kg, then it increased to over 70kg in 1970. After which, the figure declined to 60kg at the end of the period. The figure for seafood, however, remained around 20kg throughout the period.
範文詳情
The graph below shows food consumption in Australia between 1950 and 2010.
22/07/2026 06:52 7.0 分
主題
The graph below shows food consumption in Australia between 1950 and 2010.
字數: 222
圖表
Essay
總分
7.0±0.5
良好
寫作標準分數
TA7.0
CC7.0
LR7.0
GRA7.0
點擊作文中任何被標示的文字,查看詳細的改善建議。
深度分析
Task 1 - Academic Writing
4 tools available
範文 - IELTS Writing Task 1
尚無範文
請點擊下方按鈕,分析並產生 Task 1 的高品質範文。