
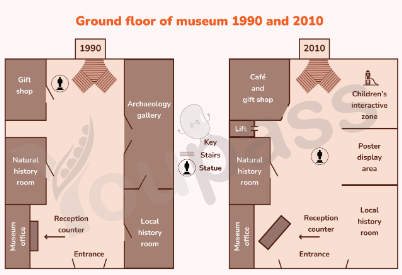
The floor plans illustrate the modifications made to the ground floor layout of a museum over the twenty-year period between 1990 and 2010. Overall, the museum experienced a process of significant reorganisation to provide more amenities targeted at visitors. The most noticeable modifications were the transition from the archaeology gallery to the children's interactive zone and the poster display area, and the expansion of the gift and cafe shop, while most core historical exhibition spaces remained unchanged. Starting from the left-hand side of this building, in 1990, there was a separate gift shop in the top left corner, which was directly next to the natural history room below. In 2010, the gift shop was combined with a coffee shop, resulting in a bigger coffee and gift shop. The natural history room was placed in the old area; however, a lift was contributed on the right side of this room. While the entrance area was expanded, the reception counter, which was initially placed horizontally near the entrance, had been repositioned at an angle by 2010. Regarding the building's right-hand side, by 1990, the archaeology galleryhad accounted for most of this area, possessing a large rectangular space, while the local history room had been allocated to the bottom right corner. After 20 years, the archaeology gallery was destroyed to make room for three new areas, including a children's interactive zone in the top right, a poster display area directly in the middle right and the local history room, which was widened at the bottom right side. Finally, one of the viable adjustments is the monument, which was relocated from the top left-hand side in 1990 to the building's center area after two decades.
Sample Detail
The plans below show the layout of the ground floor of a museum in 1990 and 2010. Summarise the information by selecting and reporting the main features, and make comparisons where relevant.
22/07/2026 06:54 7.0 points
Topic
The plans below show the layout of the ground floor of a museum in 1990 and 2010. Summarise the information by selecting and reporting the main features, and make comparisons where relevant.
Word count: 281
Chart/Graph
Essay
Overall Scores
7.0±0.5
Good
Writing Criteria Scores
TA7.0
CC7.0
LR7.0
GRA7.0
Click on any highlighted text in the essay to view detailed suggestions for improvement.
Deep Analysis
Task 1 - Academic Writing
4 tools available
Sample Essay - IELTS Writing Task 1
No sample essay
Click the button below to analyze and generate a high-quality sample essay for Task 1.