
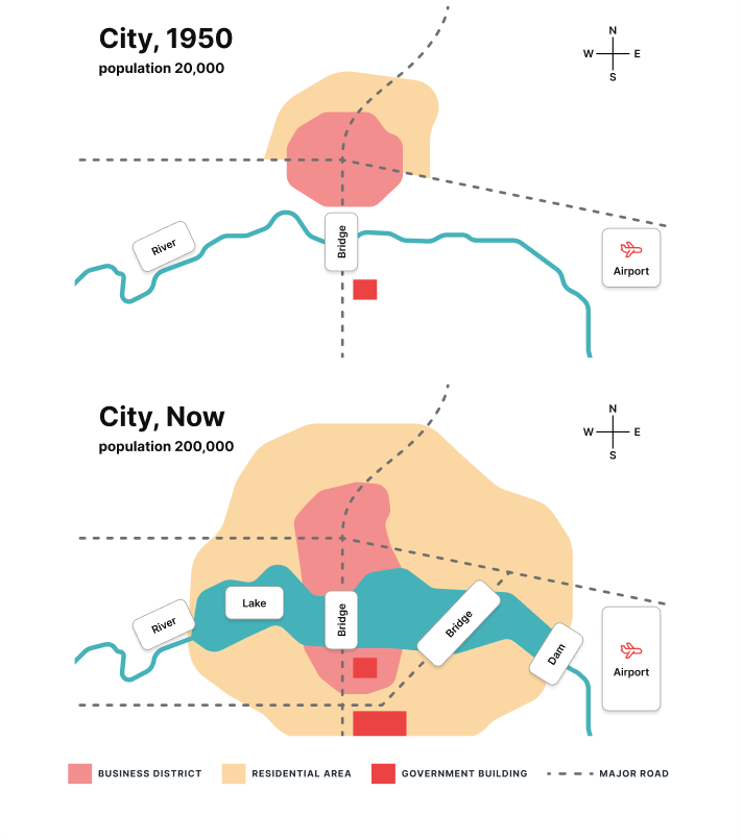
The map illustrates the transformation that has occurred in a particular city between 1950 and now. Overall, the city has been far more urbanized and modernized, with major expansions in residential zones and transport infrastructure. In 1950, the city was comparatively small, accommodating a population of 20,000 residents. The compact business district was situated in a south-central part, surrounded by limited residential areas. Moreover, a river flowed through the southern part of the city, crossed by only one bridge. A government building was located to the south of the bridge, whereas a small airport was positioned on the eastern outskirts of the city. At present, the city has been expanded dramatically and the population has surged tenfold to 200,000 city dwellers. It is also of note that the middle part of the river has been converted into a large lake, with a dam constructed at the eastern end of it. Furthermore, an additional major road has been built in the south, leading to one new bridge added near the dam. The business districts have been enlarged vertically and now positioned in both sides of the lake, while the residential zones have been broadened remarkably. In addition, one government building has been erected in the southern part of the city, whereas the airport has been extended substantially.
Detail Sampel
The map show changes in a city in 1950 and now.
22/07/2026 07:02 6.5 skor
Topik
The map show changes in a city in 1950 and now.
Jumlah kata: 216
Grafik/Diagram
Essay
Skor Keseluruhan
6.5±0.5
Cukup
Skor Kriteria Writing
TA6.0
CC7.0
LR7.0
GRA7.0
Klik teks yang ditandai di esai untuk melihat saran detail untuk peningkatan.
Analisis mendalam
Task 1 - Academic Writing
4 tools available
Esai contoh - IELTS Writing Task 1
Belum ada esai contoh
Silakan klik tombol di bawah untuk menganalisis dan membuat esai contoh berkualitas tinggi untuk Task 1.