
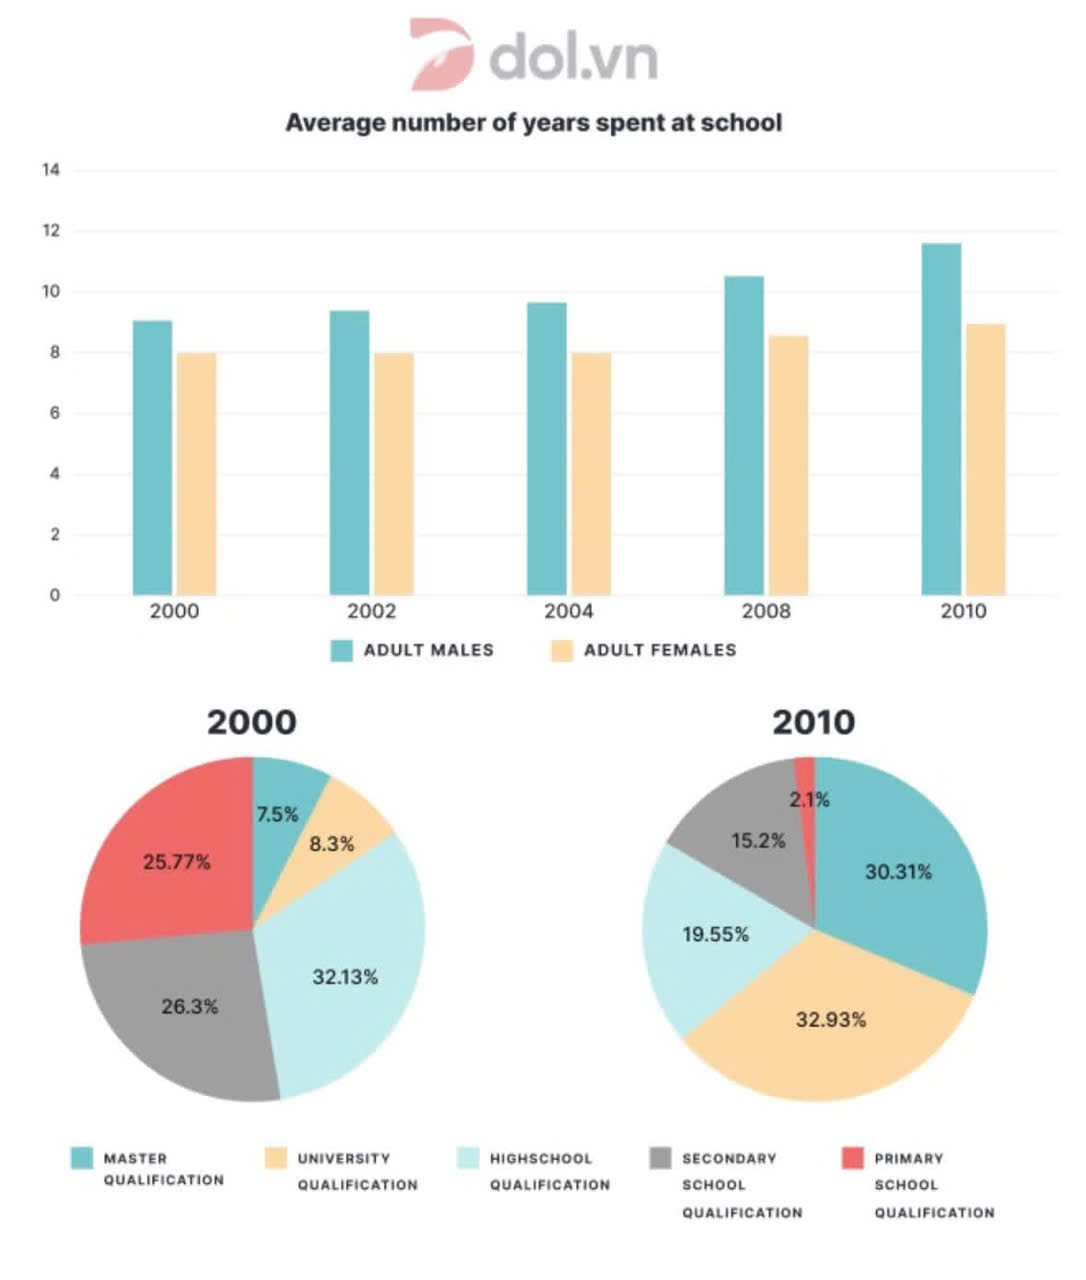
The bar chart illusatrates the average years that adult males and females spend at school from 2000 to 2010, while the pie charts present the percentage of 5 different qualifications were taken in the first and the last year in the similar period. Overall, it is clear that the number of school years increased over time for both male and females. Notably, men were consistently spent a longer time at school compared to the women. In addition, while the master qualification and university qualification were became more popular throughout the period, with the most common being the university, the remaining qualifications witnessed an opposite trend. Regarding the bar chart, while the school year of male steadily increased from around 9 to nearly 12, the peak of the chart, the female’s counterpart only slowly grew from 8 to the male’s initial point. Moving on to the pie charts, although the two least popular qualifications in 2000 were the master and university qualification at only 7.5% and 8.3%, these two experienced a surge to 30,31% and 32.93% throughout the period, becoming the two most common at the end. Conversely, while the highschool qualification stood at 32.23%, the largest firgue in the first year, it sharply fell to under 20% over the 10-years period. Notably the primary and secondary school qualification exhibited the two most significant drop, with a roughly 10% decrease from 26.3% for the secondary and above 20% from 25.77% for the primary qualification.
รายละเอียดตัวอย่าง
compare and present key feature
22/07/2026 11:52 6.5 คะแนน
หัวข้อ
compare and present key feature
จำนวนคำ: 243
แผนภูมิ/กราฟ
Essay
คะแนนรวม
6.5±0.5
ดีพอใช้
คะแนนเกณฑ์การเขียน
TA7.0
CC7.0
LR6.0
GRA7.0
คลิกข้อความที่ไฮไลต์ในเรียงความเพื่อดูคำแนะนำรายละเอียดเพื่อพัฒนา
การวิเคราะห์เชิงลึก
Task 1 - Academic Writing
4 tools available
บทความตัวอย่าง - IELTS Writing Task 1
ยังไม่มีบทความตัวอย่าง
กดปุ่มด้านล่างเพื่อวิเคราะห์และสร้างบทความตัวอย่างคุณภาพสูงสำหรับ Task 1