
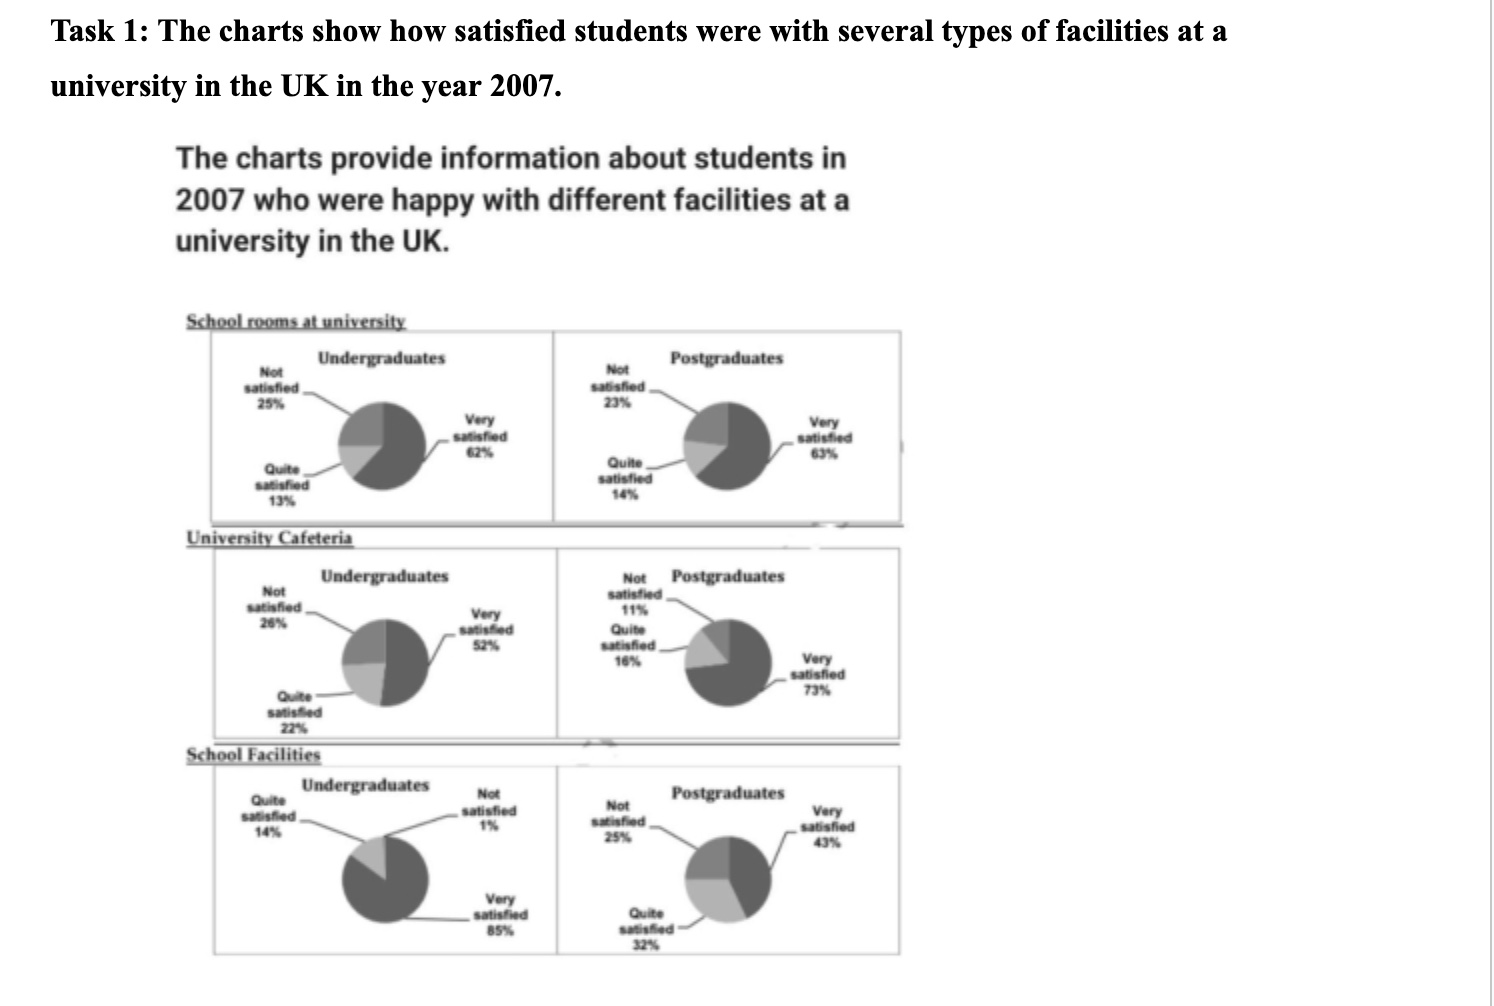
The six pie charts break down the proportions of undergraduate and postgraduate students expressing different levels of satisfaction with three categories of facilities at a UK university in 2007. Overall, positive responses outweighed negative ones for all three facilities among both undergraduate and postgraduate students, with the “ very satisfied” category accounting for the largest in almost every chart.In general, postgraduates gave more favourable ratings than undergraduates, although the opposite pattern was observed for school facilities. Regarding school rooms at university, satisfaction levels were almost identical among undergraduates and postgraduates. Roughly three fifths of both student groups expressed a high level of satisfaction (62% and 63%, respectively), whereas only about one quarter reported dissatisfaction, meaning the former proportions were more than doubled than the latter. Meanwhile, students who were quite satisfied only represented 13% for undergraduates, 14% for postgraduates,highlighting the near-uniform distribution between the two cohorts. A more pronounced disparity emerged in students' attitudes towards the university cafeteria. The largest share belongs to the very satisfied category in postgraduates made up nearly three in four, surpassing the corresponding figure in undergraduates with just over half of the total. By contrast, undergraduates were considerably more likely to report lower levels of satisfaction, with 26% being dissatisfied and 22% quite satisfied, whereas the corresponding figures for postgraduates were only 11% and 16%. School facilities constituted the sole exception to the overall trend. As many as 85% of undergraduates were very satisfied, almost twice the proportion recorded among postgraduates (43%). By contrast, the shares of postgraduates who were quite satisfied and dissatisfied reached 32% and 25%, both substantially exceeding the corresponding undergraduate figures of 14% and only 1%, respectively. Notably, the proportion of dissatisfied postgraduates was twenty-five times that of undergraduates, representing by far the widest gap observed across the six charts
Detail Sampel
The chart illustrates the proportion of students at a university who were satisfied with various on-campus facilities in 2007
22/07/2026 11:52 9.0 skor
Topik
The chart illustrates the proportion of students at a university who were satisfied with various on-campus facilities in 2007
Jumlah kata: 299
Grafik/Diagram
Essay
Skor Keseluruhan
9.0±0.5
Sangat baik
Skor Kriteria Writing
TA9.0
CC9.0
LR9.0
GRA9.0
Klik teks yang ditandai di esai untuk melihat saran detail untuk peningkatan.
Analisis mendalam
Task 1 - Academic Writing
4 tools available
Esai contoh - IELTS Writing Task 1
Belum ada esai contoh
Silakan klik tombol di bawah untuk menganalisis dan membuat esai contoh berkualitas tinggi untuk Task 1.