
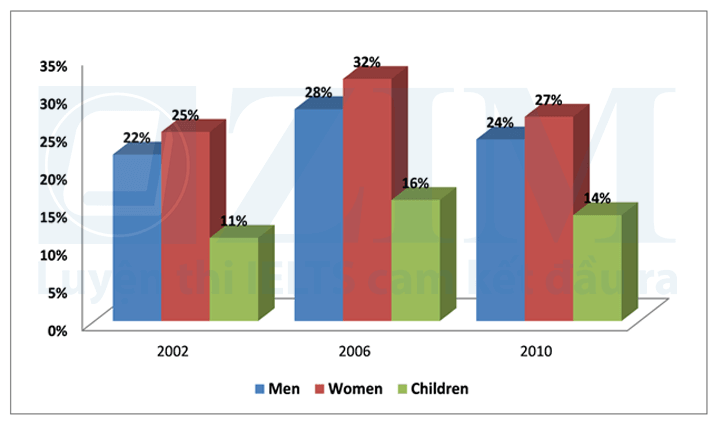
The given bar chart illustrates the proportion of the people living in Britain who ate the suggested amount of fruit and vegetables on a daily basis from 2002 to 2010. Overall, three groups of residents all witnessed a similar pattern: the figure increased over the first four years before declining in the later period. Additionally, British women's consumption of fruit and vegetables was far higher than the two remaining groups. As regard men and women, their consumption witnessed a slightly increase by 7% over the first four year. In 2010, the percentage of men consuming recommended daily fruit and vegetables dropped to 24% while that for women was 27%, making women the group with the highest proportion compared to their counterparts in the whole period. Looking at the children's group, the consumption of fruit and vegetables fluctuated between 11% and 14% throughout the given timeframe. In 2010, the figure for children stood at 14% which was roughly half the figure of women.
Sample Detail
The chart below shows the percentage of the population in the UK who consumed the recommended daily amount of fruit and vegetables in 2002, 2006 and 2010.Summarise the information by selecting and reporting the main features, and make comparisons where relevant.
22/07/2026 12:06 6.5 points
Topic
The chart below shows the percentage of the population in the UK who consumed the recommended daily amount of fruit and vegetables in 2002, 2006 and 2010.Summarise the information by selecting and reporting the main features, and make comparisons where relevant.
Word count: 162
Chart/Graph
Essay
Overall Scores
6.5±0.5
Fair
Writing Criteria Scores
TA7.0
CC7.0
LR6.0
GRA6.0
Click on any highlighted text in the essay to view detailed suggestions for improvement.
Deep Analysis
Task 1 - Academic Writing
4 tools available
Sample Essay - IELTS Writing Task 1
No sample essay
Click the button below to analyze and generate a high-quality sample essay for Task 1.