
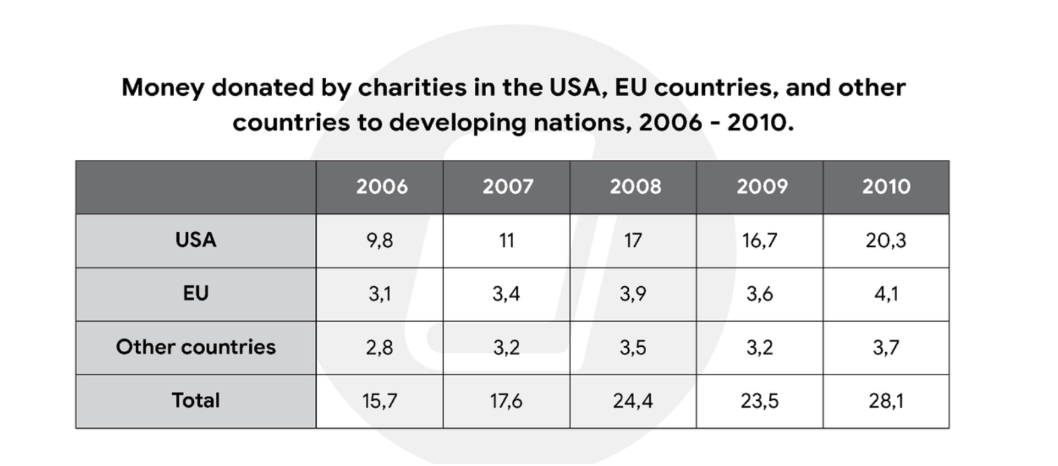
The given table illustrates the financial supports made by the USA, EU countries and Other countries to less developed nation from 2006 to 2010, expressed in millions of dollars. It is noticeable that the amount of donated money by charities in three main groups increased considerably over the five-year period. The USA was recognized as the largest donor as compared to the remainder of categories. In regard to the USA, this country recorded as the highest figures from 2006 to 2010. Starting at 9.8 million dollars in 2006, the financial aid went up significantly to 17 million in 2008 before slightly decreasing to 16.7 million in 2009. Whereas, this leading country witnessed a growth to 20.3 million dollars at the end of this surveyed period. The EU and Other countries also shared a similar trend, in contrast, the figures for donations by charitable organizations in these two nations were relatively lower than those of the USA overall. Turning to the EU, there was an upward trend in the amount of donations from 3.1 million in 2006 to 3.9 million dollars in 2009, followed by a small decline by 0.3 million in 2009, before growing to approximately 4.1 million in 2010. A similar pattern was seen in Other countires, in which financial aid rose from 2.8 to 3.7 million between 2006 and 2010, despite a minor drop in the same year.
নমুনা বিস্তারিত
The table shows the amount of money donated by charities in the USA, EU countries, and other countries to developing nations between 2006 and 2010, measured in millions of dollars. Provide an overview of the information by identifying and describing the key details, and include informations where appropriate.
22/07/2026 12:25 7.0 স্কোর
টপিক বা বিষয়
The table shows the amount of money donated by charities in the USA, EU countries, and other countries to developing nations between 2006 and 2010, measured in millions of dollars. Provide an overview of the information by identifying and describing the key details, and include informations where appropriate.
শব্দ সংখ্যা: 230
চার্ট/গ্রাফ
Essay
সামগ্রিক স্কোর
7.0±0.5
ভালো
রাইটিং মানদণ্ড স্কোর
TA7.0
CC7.0
LR7.0
GRA7.0
উন্নতির জন্য বিস্তারিত পরামর্শ দেখতে প্রবন্ধের হাইলাইট করা যেকোনো লেখায় ক্লিক করুন।
গভীর বিশ্লেষণ
Task 1 - Academic Writing
4 tools available
নমুনা রচনা - IELTS Writing Task 1
কোনো নমুনা রচনা নেই
টাস্ক ১-এর জন্য উচ্চমানের নমুনা রচনা বিশ্লেষণ এবং তৈরি করতে নিচের বাটনে ক্লিক করুন।