
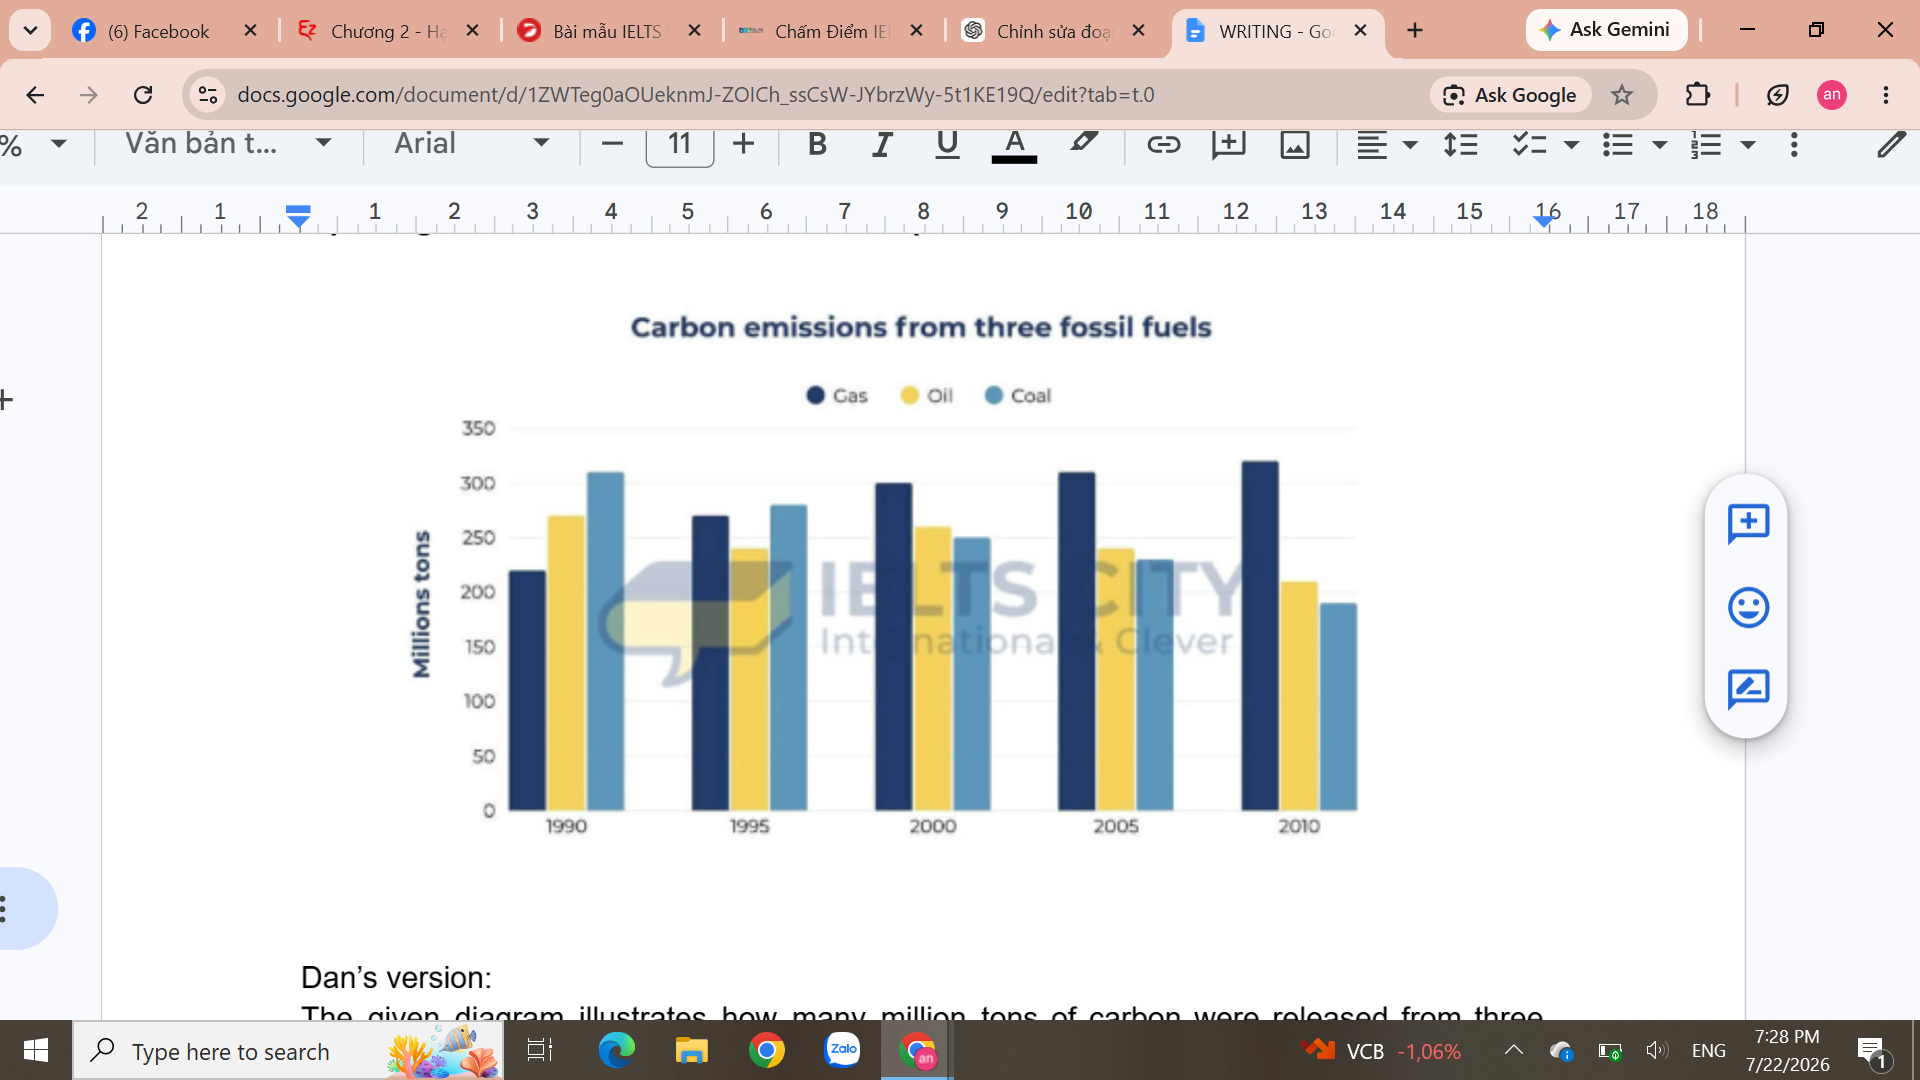
The given diagram illustrates how many million tons of carbon were released from three fossil fuels (oil, coal and gas) in the United Kingdom between 1990 and 2010. Overall, the period was characterized by a reverse trend: while gas emissions increased significantly from the lowest to the highest level at the end of the period, coal emissions declined sharply from the peak to the bottom. Furthermore, emissions from oil underwent a steady decrease. In the first year, gas held the lowest emission level at around 225 million tons. However, over a two-decade period, this figure sharply increased and reached the peak at 325 million tons by 2010. By contrast, coal initially recorded the highest emissions at 310 million tons in 1990, before witnessing a 120-million-ton fall to 190 million tons, which only represented two-thirds of the volume emitted by gas in the final year. Regarding oil, emissions from oil stood at 270 million tons at the beginning, which was 40 million tons less than the coal emissions at that time. In the first decade, this figure fluctuated slightly around the 250 million tons mark, then saw a considerable decrease to 210 million tons, ending the period as the second-highest source.
รายละเอียดตัวอย่าง
the graph below shows the three different kinds of emission sources (oil/ coal/ gas) of greenhouse gas in the UK. Summarize the information by selecting and reporting the main features and make comparisons where relevant.
22/07/2026 12:28 7.0 คะแนน
หัวข้อ
the graph below shows the three different kinds of emission sources (oil/ coal/ gas) of greenhouse gas in the UK. Summarize the information by selecting and reporting the main features and make comparisons where relevant.
จำนวนคำ: 200
แผนภูมิ/กราฟ
Essay
คะแนนรวม
7.0±0.5
ดีมาก
คะแนนเกณฑ์การเขียน
TA7.0
CC7.0
LR7.0
GRA7.0
คลิกข้อความที่ไฮไลต์ในเรียงความเพื่อดูคำแนะนำรายละเอียดเพื่อพัฒนา
การวิเคราะห์เชิงลึก
Task 1 - Academic Writing
4 tools available
บทความตัวอย่าง - IELTS Writing Task 1
ยังไม่มีบทความตัวอย่าง
กดปุ่มด้านล่างเพื่อวิเคราะห์และสร้างบทความตัวอย่างคุณภาพสูงสำหรับ Task 1