
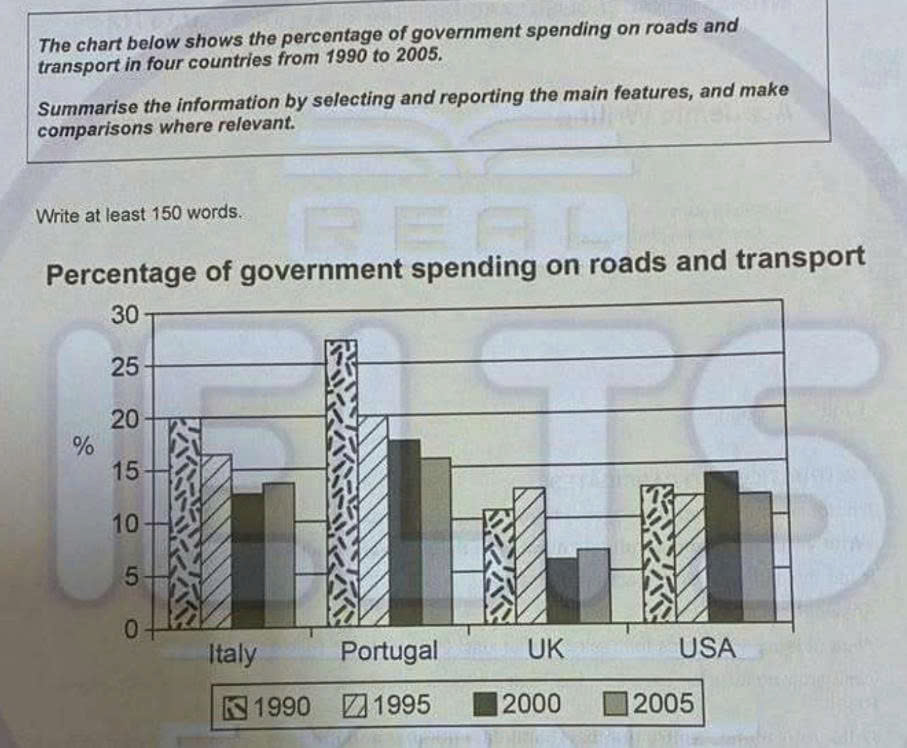
The bar chart illustrates the percentage of government spending devoted to road and transport infrastructure across four countries: Italy, Portugal, the UK, and the USA across four separate years: 1990, 1995, 2000, and 2005. What is most striking when looking at the data is an overall decline in budget allocation across the European nations, contrasting with a considerably flatter trajectory in the USA. Equally noteworthy is that despite Portugal consistently leading the chart, the overall gap between the highest and lowest spending figures narrowed substantially by the end of the period. Looking first at the higher-spending nations, the largest allocations were recorded in Portugal and Italy, although both countries experienced noticeable overall declines over the 15-year period. Portugal initiated the period with the highest share among all nations, at around 27% in 1990. Although its budgetary allocation consistently dropped to just over 15% by 2005—effectively halving its initial figure—the country nevertheless firmly maintained its top spot throughout. Similarly, Italy’s public expenditure began at 20% before slipping to roughly 13% in 2000. A marginal recovery to about 14% followed in the final year, which enabled Italy to consolidate its status as the runner-up, albeit slightly below Portugal. Turning to the lower-spending nations, the USA and the UK demonstrated contrasting trajectories despite starting at similar levels. In 1990, both countries allocated just over 10% of their national budgets to roads and transport, with the USA holding a slight edge. A notable shift occurred in 1995, when the UK’s expenditure surged to approximately 13%, temporarily overtaking that of the USA, which had dipped to around 12%. However, this pattern was reversed in 2000 as the UK’s allocation plummeted to a period-low of under 7%, before a minor rebound to nearly 8% in 2005. By contrast, the USA saw a brief peak at 15% in 2000 before settling at 13% in the final year, firmly establishing itself above the UK as the third-largest spender.
नमूना विवरण
The chart below shows the percentage of government spending on roads and transport from 1980 to 2005.
22/07/2026 12:30 9.0 अंक
विषय
The chart below shows the percentage of government spending on roads and transport from 1980 to 2005.
शब्दों की संख्या: 320
चार्ट/ग्राफ
Essay
समग्र स्कोर
9.0±0.5
उत्कृष्ट
राइटिंग मानदंड स्कोर
TA9.0
CC9.0
LR9.0
GRA9.0
सुधार के विस्तृत सुझाव देखने के लिए लेख में किसी भी हाइलाइट किए गए टेक्स्ट पर क्लिक करें।
गहन विश्लेषण
Task 1 - Academic Writing
4 उपकरण उपलब्ध
नमूना लेख - IELTS Writing Task 1
कोई नमूना लेख नहीं
Task 1 के लिए उच्च-गुणवत्ता वाला नमूना लेख विश्लेषण और बनाने के लिए नीचे दिए गए बटन पर क्लिक करें।