
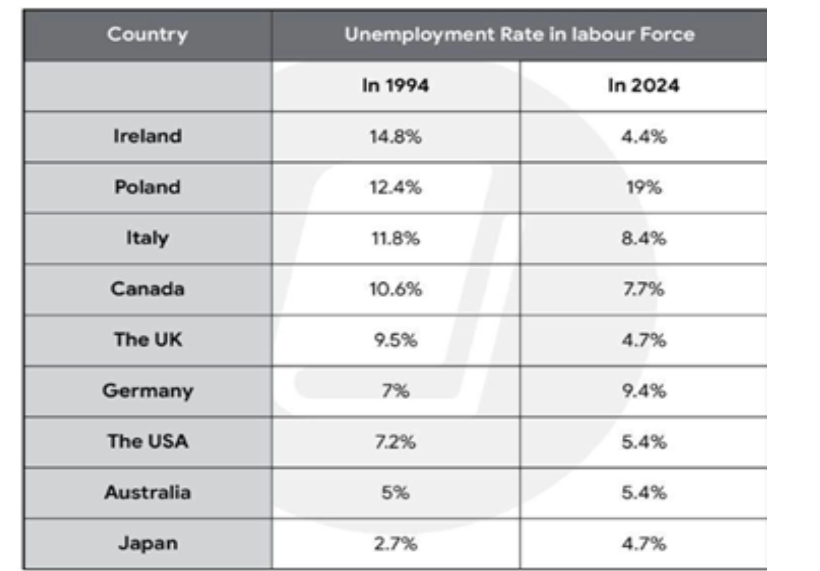
The table illustrates the proportion of unemployment in the labour force of nine different countries in 2 separate years, namely 1994 and 2004. Overall, the percentage of Ireland, Italy, Canada, the UK and the USA declined, whereas the remaining countries saw varying degrees of growth. It is notable that the figure for Poland experienced by far the most significant rise, overtaking all other nations to become a country with the highest unemployment rate. Focusing first on countries where unemployment rose, the percentage of unemployment in Poland recorded a dramatic growth, with its unemployment rate climbing sharply from 12.4% in 1994 to 19% in 2004. The figure for Germany followed the same upward trend but at a lower level, rising steadily from 7% to 9.4% in 2004. A marked growth was observed in Japan, whose jobless rate almost doubled from 2.7% in 1994 to 4.7% in 2004 although it is still lower than Australia’s. Meanwhile, the figure for Australia witnessed a slight rise from 5% to 5.4% in 2004. Moving on to countries where unemployment declined, the most significant decrease occurred in Ireland, which went down from the country having the highest jobless rate to the lowest, shrinking from 14.8% in 1994 to just 4.4% in 2004. A similar pattern was observed in the UK, but to a lesser extent, which fell by almost half from 9.5% in 1994 to 4.7% in 2004. Likewise, Italy and Canada recorded moderate declines, dropping from 8.4% to 7.7%. The figure for the USA witnessed the most marked decrease, with its figure falling from 7.2% in 1994 to 5.4% in 2004.
नमूना विवरण
The table below shows the percentage of the labour force unemployed across nine countries in 1994 and 2004. Provide an overview of the information by identifying and describing the key details, and include comparisons where appropriate.
22/07/2026 12:35 7.0 अंक
विषय
The table below shows the percentage of the labour force unemployed across nine countries in 1994 and 2004. Provide an overview of the information by identifying and describing the key details, and include comparisons where appropriate.
शब्दों की संख्या: 266
चार्ट/ग्राफ
Essay
समग्र स्कोर
7.0±0.5
अच्छा
राइटिंग मानदंड स्कोर
TA7.0
CC7.0
LR7.0
GRA7.0
सुधार के विस्तृत सुझाव देखने के लिए लेख में किसी भी हाइलाइट किए गए टेक्स्ट पर क्लिक करें।
गहन विश्लेषण
Task 1 - Academic Writing
4 उपकरण उपलब्ध
नमूना लेख - IELTS Writing Task 1
कोई नमूना लेख नहीं
Task 1 के लिए उच्च-गुणवत्ता वाला नमूना लेख विश्लेषण और बनाने के लिए नीचे दिए गए बटन पर क्लिक करें।