
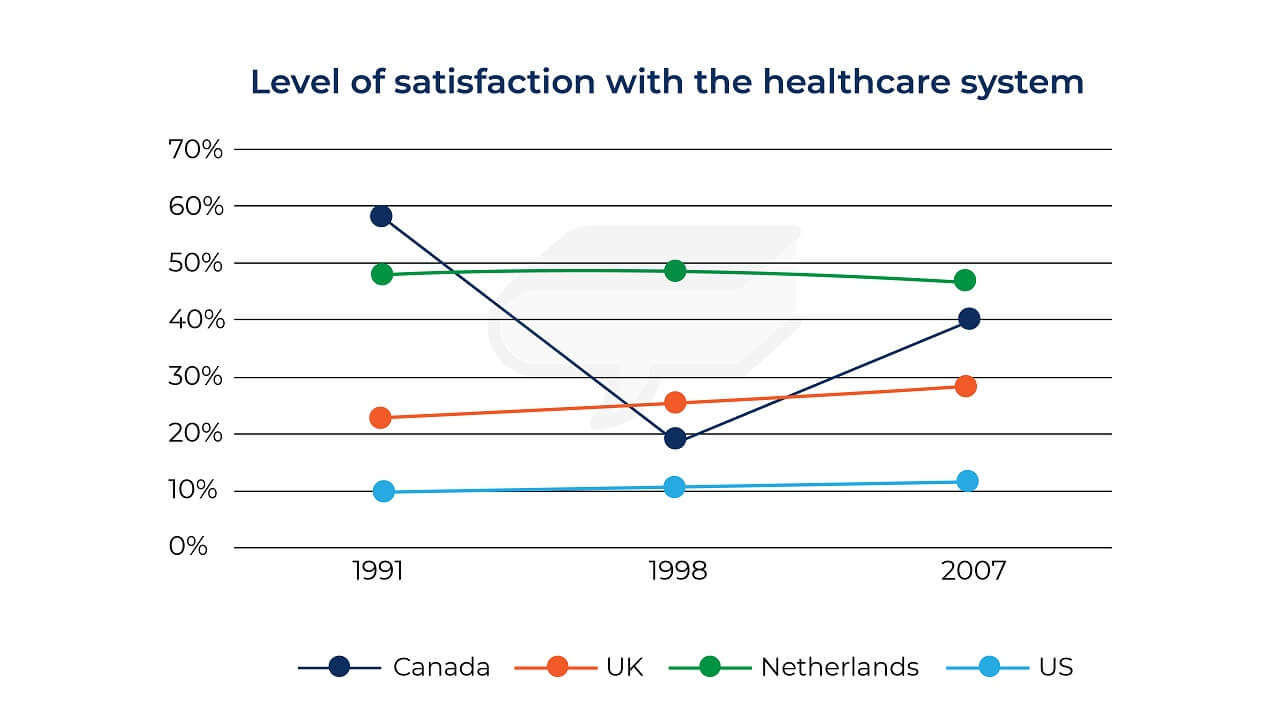
The graph shows people’s level of satisfaction with the health care system in 4 countries between 1991 and 2007. Overall, the Netherlands consistently had the highest satisfaction levels and remained stable throughout the period. Meanwhile, the US claimed the lowest satisfaction rates in the period of three years while Canada experienced a notable fluctuation and the UK witnessed a remarkable increase in public satisfaction. For the US, starting with the lowest percentage of 10% in 1991, the figure exhibited minor fluctations over 16-year period and reached 12% in 1007. Meanwhile, the UK had a minimum satisfaction rate of 22% from 1911 and the figure experienced minor growth up to 29% in 2007 For Netherlands, their healthcare systems had higher rate than the previous figures with 48%. Even though there was a small rise of 1% in the percentage rate, the figure then decreased markedly to 47%. In 1991, Canada acquired the highest figure in 1991 at 58%. However, the figure experienced a sharp drop at 19% in 1998, whereas the opposite was true to for the next 9 years and the figure reached 40% in 2007
Sample Detail
The graph shows people’s level of satisfaction with the health care system in 4 countries between 1991 and 2007.
22/07/2026 13:11 6.0 points
Topic
The graph shows people’s level of satisfaction with the health care system in 4 countries between 1991 and 2007.
Word count: 186
Chart/Graph
Essay
Overall Scores
6.0±0.5
Fair
Writing Criteria Scores
TA6.0
CC6.0
LR6.0
GRA6.0
Click on any highlighted text in the essay to view detailed suggestions for improvement.
Deep Analysis
Task 1 - Academic Writing
4 tools available
Sample Essay - IELTS Writing Task 1
No sample essay
Click the button below to analyze and generate a high-quality sample essay for Task 1.