
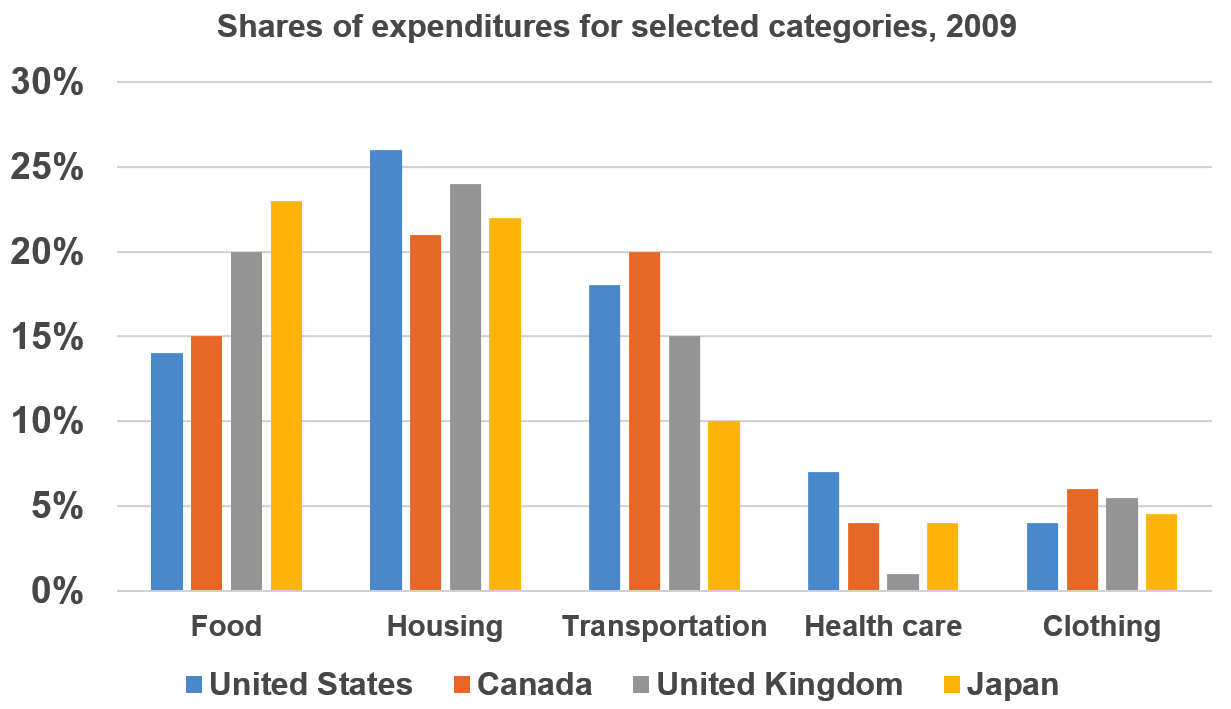
The diagram illustrates the rates of spending on four categories including food, housing, means of transport, health services and clothing. It is clear that USA has the highest percentage in spending on housing. While sharing of expenses for health services in UK is lowest in the rates. As can be seen from the chart, nearly 27% of American's budgets is spent on housing which is highest in 4 countries. The rates of sharing expenditure for housing in Canada, USK,Japan is respectively about 22%, 24%,23%.Japanese's finance is spent most on Food among all countries which 9% higher than USA which is the lowest countries. The percentage of sharing of expenses for means of transport in Canada is highest with 20%, following repectively by USA,UK and Japan. Looking at the chart in more detail, both health care and clothing are spent least in all selected countries. Finances for health services in USA is highest in four nations which is about 7%, the opposite is true for the UK's expenditure. While the rates of sharing of expenses for health care in both Japan and Canada which is at the same level, is about 4%. Meanwhile, the percentage of spending on clothing is about 4% in both USA, Japan and about 7% in Canada, UK.
รายละเอียดตัวอย่าง
The bar chart shows shares of expenditures for five major categoreis in the United States, Canada, the United Kingdom, and Japan
22/07/2026 13:23 5.5 คะแนน
หัวข้อ
The bar chart shows shares of expenditures for five major categoreis in the United States, Canada, the United Kingdom, and Japan
จำนวนคำ: 211
แผนภูมิ/กราฟ
Essay
คะแนนรวม
5.5±0.5
พื้นฐาน
คะแนนเกณฑ์การเขียน
TA6.0
CC6.0
LR5.0
GRA6.0
คลิกข้อความที่ไฮไลต์ในเรียงความเพื่อดูคำแนะนำรายละเอียดเพื่อพัฒนา
การวิเคราะห์เชิงลึก
Task 1 - Academic Writing
4 tools available
บทความตัวอย่าง - IELTS Writing Task 1
ยังไม่มีบทความตัวอย่าง
กดปุ่มด้านล่างเพื่อวิเคราะห์และสร้างบทความตัวอย่างคุณภาพสูงสำหรับ Task 1