
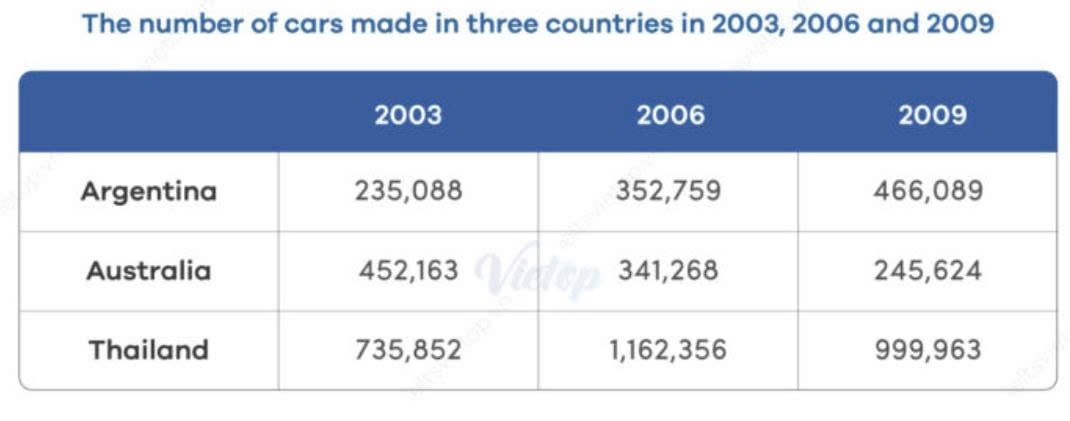
The given table provides information about how many cars were manufactured in three different countries in three years 2003,2006 and 2009. Overall, it can be seen that the figures for both Argentina and Thailand were upward with the exception of Australia. In addition, Thailand recorded the highest throughout the given period. In terms of Argentina and Australia, in 2003, their numbers of cars produced stood at 235,088 and 452,163 respectively. After three years, in 2006, there was a significant rise in the number of manufactured cars to 352,759. By contrast, the figure for Australia dropped remarkably to 341,268. Finally, in 2009; 466,089 cars were made in Argentina which were nearly two times higher than Australia’s car production (245,624). When it comes to Thailand, its figure was initially at 735,852. Over a three-year period, the number of cars produced reached a peak at nearly 1,2 million cars, followed by a plunge to 999, 963 cars by 2009.
รายละเอียดตัวอย่าง
The table below shows the number of cars made in three countries in 2003, 2006 and 2009.
22/07/2026 13:26 6.5 คะแนน
หัวข้อ
The table below shows the number of cars made in three countries in 2003, 2006 and 2009.
จำนวนคำ: 156
แผนภูมิ/กราฟ
Essay
คะแนนรวม
6.5±0.5
ดีพอใช้
คะแนนเกณฑ์การเขียน
TA7.0
CC7.0
LR6.0
GRA6.0
คลิกข้อความที่ไฮไลต์ในเรียงความเพื่อดูคำแนะนำรายละเอียดเพื่อพัฒนา
การวิเคราะห์เชิงลึก
Task 1 - Academic Writing
4 tools available
บทความตัวอย่าง - IELTS Writing Task 1
ยังไม่มีบทความตัวอย่าง
กดปุ่มด้านล่างเพื่อวิเคราะห์และสร้างบทความตัวอย่างคุณภาพสูงสำหรับ Task 1