
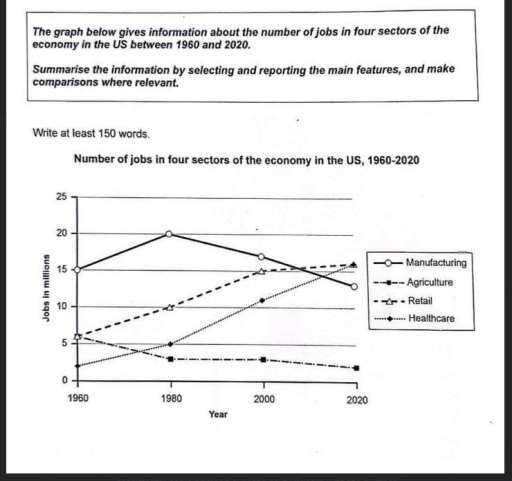
The given line graph illustrates the number of jobs relating to four fields that shape the economy of the US between 1960 and 2020. Overall, while the figures for manufacturing and agriculture workers experienced downward trends, those for retail and healthcare fields showed upward trends. Notably, the dominating position of each sector changed over the given period. With regard to manufacturing and agriculture, the number of workers in those fields declined, with a more remarkable pattern in the former. Starting at precisely 15 million in 1960, the proportion of manufacturing workers reached a peak at 20 million over the next 20 years, followed by a continuous drop through the end of the period, decreasing by nearly 7,5 million. In contrast, that of agricultural workers was significantly lower in comparison, which initially witnessed a drop of around 3 million workers in 1980 before generally levelling off at the same figure until 2020. Moving on to the retail and healthcare sectors, both of them underwent increments. Despite beginning at different bases (more than 5 million workers for the former, and around 2 million for the latter), their figures followed similar increases to the year 2000. After that, the rising rate of job vacancies in retail slowed down, only rising by 1 million, while the other sector continued to rise, ending up at the highest figure of 16 million jobs.
Detail Sampel
The graph below gives information about the number of jobs in four sectors of the economy in the US between 1960 and 2020.
22/07/2026 13:32 7.5 skor
Topik
The graph below gives information about the number of jobs in four sectors of the economy in the US between 1960 and 2020.
Jumlah kata: 227
Grafik/Diagram
Essay
Skor Keseluruhan
7.5±0.5
Baik
Skor Kriteria Writing
TA8.0
CC8.0
LR7.0
GRA8.0
Klik teks yang ditandai di esai untuk melihat saran detail untuk peningkatan.
Analisis mendalam
Task 1 - Academic Writing
4 tools available
Esai contoh - IELTS Writing Task 1
Belum ada esai contoh
Silakan klik tombol di bawah untuk menganalisis dan membuat esai contoh berkualitas tinggi untuk Task 1.