
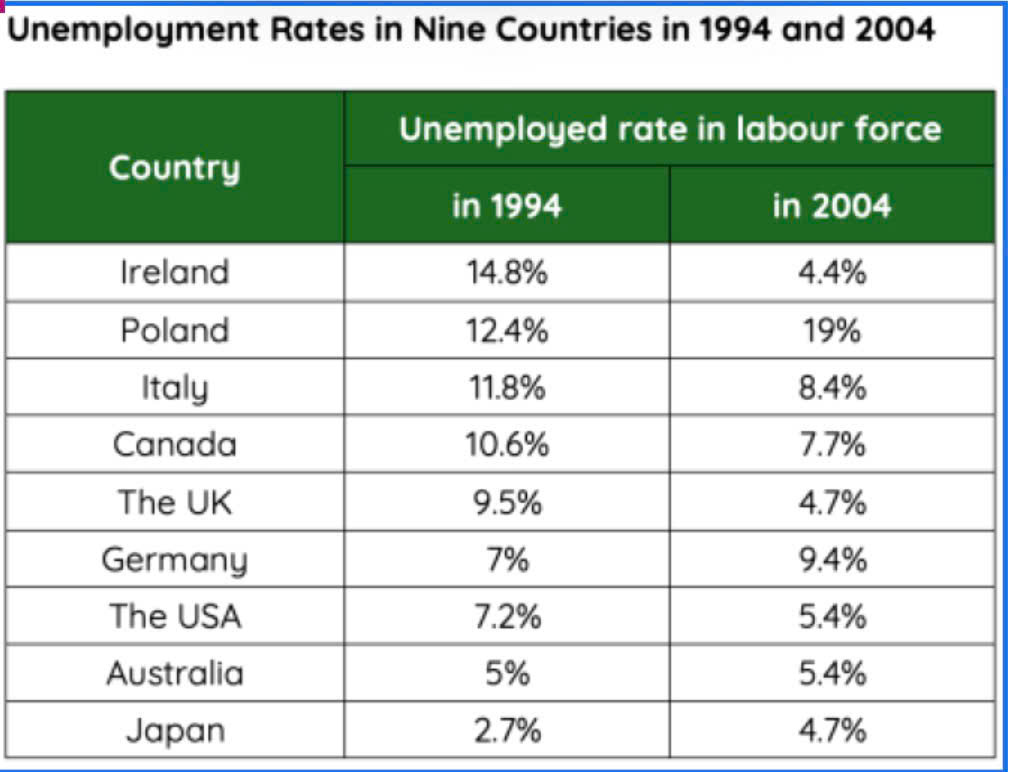
The following table illustrates how the percentage of unemployed individuals in the total workforce of various nations, including Ireland, Poland, Italy, Canada, The UK, Germany, The USA, Australia, and Japan, has changed over a 10-year period, starting from 1994. Overall, what stands out from the table is that most figures experienced a downturn, whereas those of Poland, Germany, Australia, and Japan showed an upward trend. Additionally, although Ireland’s unemployment rate was the highest in the first year, it then became the lowest, and that of Poland was ranked first in 2004. In detail, the percentage of Ireland’s unemployed people in 1994 was 14.8%, which was the greatest among nine countries during the period. Then, it decreased significantly by 10.4% after a decade, becoming the lowest rate. In addition, 11.8% of Italians had not had a career in the first year. As time went by, the figure for Italy witnessed a contraction to 8.4% by 2004. Similarly, starting with 10.6% in 1994, Canadian’s joblessness rate declined slightly to 7.7% in the final year. Likewise, the proportion of people out of work in The UK and The USA was below 10% at the beginning. After that, both figures dropped to 4.7% and 5.4%, respectively. Meanwhile, 12.4% of people in Poland were unemployed in 1994. By 2004, this rate added up to 19%, surpassing that of Ireland and becoming the highest. Besides, the percentage of jobless Germans increased steadily from 7% in 1994 to 9.4% over the period. Likewise, 5% and 2.7%, respectively, were the rates of unemployment in Australia and Japan in the first year. Then, the former registered a marginal growth of 0.4%, while the latter rose by 2% in 2004.
নমুনা বিস্তারিত
The table below shows the percentage of unemployed people in the total labour force across nine countries in 1994 and 2004. Summarise the information by selecting and reporting the main features and make comparisons where relevant.
22/07/2026 13:41 7.0 স্কোর
টপিক বা বিষয়
The table below shows the percentage of unemployed people in the total labour force across nine countries in 1994 and 2004. Summarise the information by selecting and reporting the main features and make comparisons where relevant.
শব্দ সংখ্যা: 280
চার্ট/গ্রাফ
Essay
সামগ্রিক স্কোর
7.0±0.5
ভালো
রাইটিং মানদণ্ড স্কোর
TA7.0
CC7.0
LR7.0
GRA7.0
উন্নতির জন্য বিস্তারিত পরামর্শ দেখতে প্রবন্ধের হাইলাইট করা যেকোনো লেখায় ক্লিক করুন।
গভীর বিশ্লেষণ
Task 1 - Academic Writing
4 tools available
নমুনা রচনা - IELTS Writing Task 1
কোনো নমুনা রচনা নেই
টাস্ক ১-এর জন্য উচ্চমানের নমুনা রচনা বিশ্লেষণ এবং তৈরি করতে নিচের বাটনে ক্লিক করুন।