
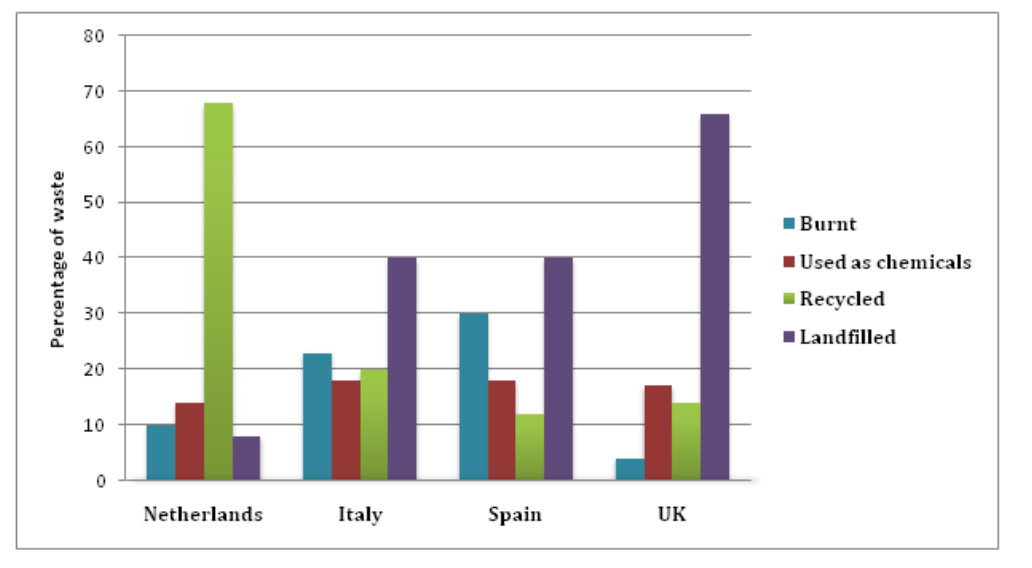
The bar chart compares the distribution of waste disposal methods in the Netherlands, Italy, Spain, and the UK, focusing on burning, chemical treatment, recycling, and landfilling. Overall, recycling used to be seen as the most common method in the Netherlands, whereas landfilling was the dominant form of waste disposal in the UK. By contrast, Italy and Spain relied more on several methods, although landfill remained the largest category in both countries. With regard to the Netherlands and UK, recycling led the chart in the Netherlands, recording the highest figure of around 70 percent. This was followed by chemical treatment, burning and landfilling, at 22 percent, 10 percent and 8 percent, respectively. By contrast, the UK relied more on landfills, at approximately 65 percent. Burnt and recycling present a much lower share compared to Netherlands, while chemical use sat at the second place in the UK. Regarding Italy and Spain, both countries presented relatively comparable patterns. Landfilling led the chart of Italy and Spain, recording the highest figure at 40%. This was followed by incineration, recycling and use of chemicals, at 22 percent, 20 percent and 18 percent, namely. Similarly, Spain recorded 30 percent for burnt, 18 percent for chemical treatment and 12 percent for recycling.
Sample Detail
The bar chart compares the percentage of waste disposed using various methods in the Netherlands, Italy, Spain and the UK.
22/07/2026 13:40 7.0 points
Topic
The bar chart compares the percentage of waste disposed using various methods in the Netherlands, Italy, Spain and the UK.
Word count: 205
Chart/Graph
Essay
Overall Scores
7.0±0.5
Good
Writing Criteria Scores
TA7.0
CC7.0
LR7.0
GRA7.0
Click on any highlighted text in the essay to view detailed suggestions for improvement.
Deep Analysis
Task 1 - Academic Writing
4 tools available
Sample Essay - IELTS Writing Task 1
No sample essay
Click the button below to analyze and generate a high-quality sample essay for Task 1.