
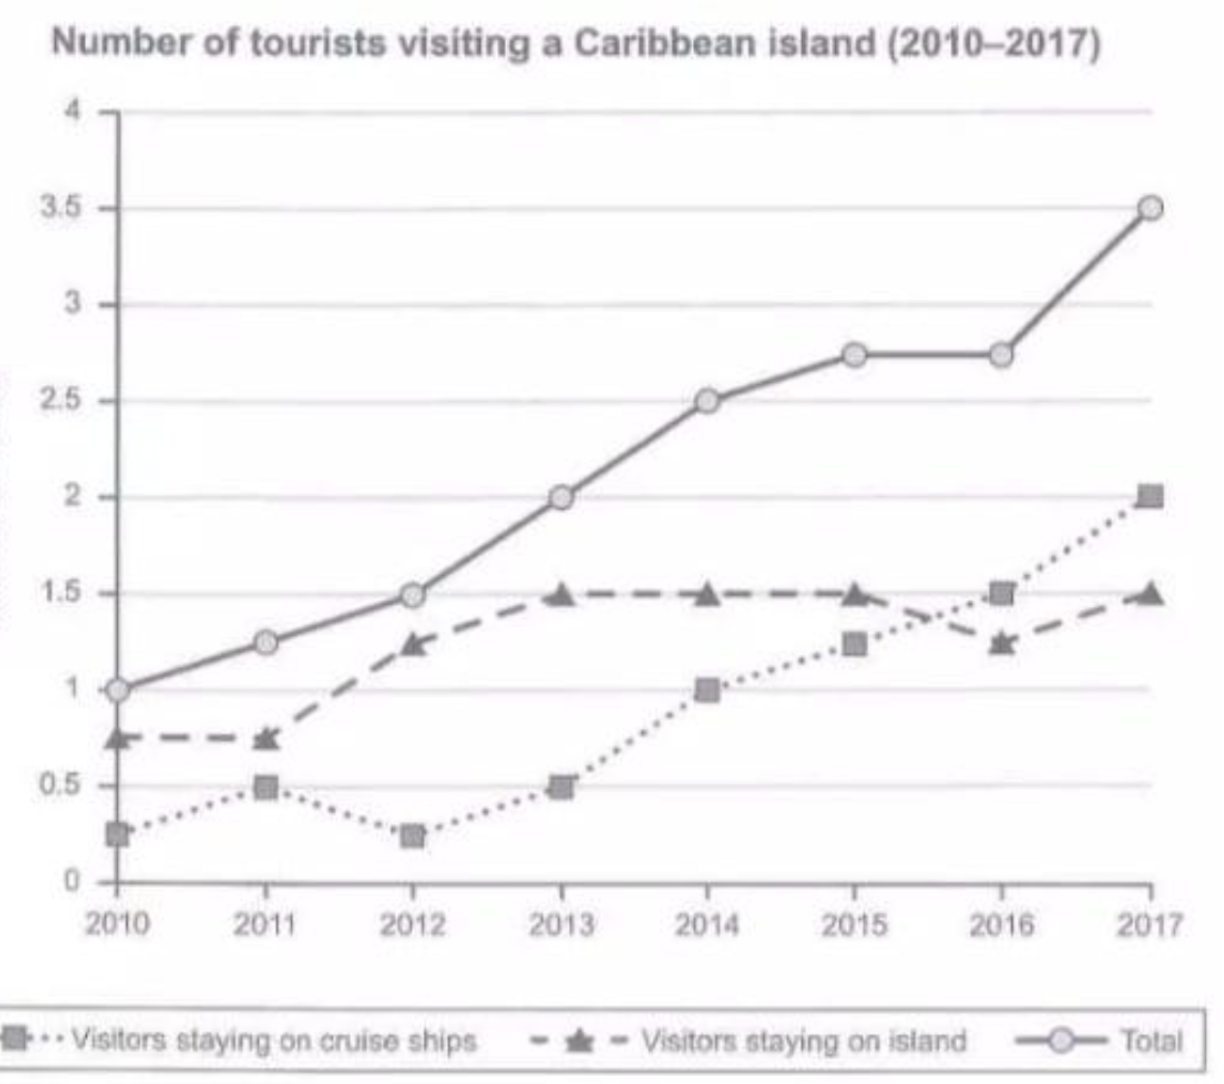
The provided line chart illustrates the number of tourists visiting a particular Caribbean island over a seven-year period from 2010 to 2017. Overall, visitors staying on cruise ships increased considerably, whereas the number of tourists staying on the island was relatively stable. In addition, the total number of visitors reached the highest figures throughout the period. In 2010, visitors staying on cruise ships stood at approximately 0.3 million, the lowest figure that year. Between 2010 and 2013, the number of visitors staying on cruise ships fluctuated between 0.3 and 0.5 million. Over the following four years, the figure rose steadily to 2 million, which was significantly higher than the starting point. By contrast, the number of visitors staying on the island remained unchanged, standing at roughly 0.7 million between 2010 and 2011. In addition, the figure stood at 1.5 million from 2013 to 2015. Between 2015 and 2017, the number of tourists staying on the island fluctuated around 1.5 million. There was a significant increase from 0.75 to 1.5 million in staying on island between 2011 and 2013.
Sample Detail
The graph below shows the number of tourists visiting a particular Caribbean island between 2010 and 2017. Summarize the information by selecting and reporting the main features, and make comparisons where relevant.
22/07/2026 13:43 7.0 points
Topic
The graph below shows the number of tourists visiting a particular Caribbean island between 2010 and 2017. Summarize the information by selecting and reporting the main features, and make comparisons where relevant.
Word count: 178
Chart/Graph
Essay
Overall Scores
7.0±0.5
Good
Writing Criteria Scores
TA7.0
CC7.0
LR7.0
GRA8.0
Click on any highlighted text in the essay to view detailed suggestions for improvement.
Deep Analysis
Task 1 - Academic Writing
4 tools available
Sample Essay - IELTS Writing Task 1
No sample essay
Click the button below to analyze and generate a high-quality sample essay for Task 1.