
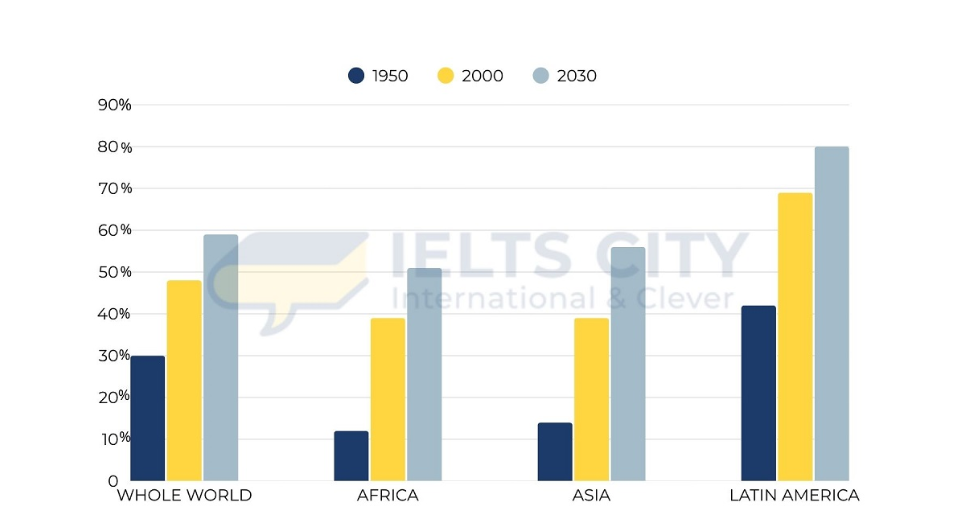
The bar chart illustrates the proportion of the number of citizen growth in specific areas in the world and predicts the figures in the future. Overview, all the areas experience an upward trend. It is also clear that Latin America has the highest level of the percentage of population growth, while Africa show the opposite pattern. Regarding the areas which witnessed a greater increase, in 1950, Latin America showed the highest figures of population with 40%, then it experienced a continued rise significantly to nearly 70% in 2000, before it is predicted to reach a peak at 80% in 2030.Likewise, the whole world also expected a steady growth sharply from 30% in 1950 to nearly 60% at the end of the period. Moving next to the areas experiencing lower growth, the population of people living in Asia is predicted to increase steadily over 80 years from about 15% to 56% in 2030. At the same time, Africa showed the lowest percentage throughout the period and it is forecast to grow gradually from 10% in 1950 to 50% toward the end of the period.
Detail Sampel
The chart below gives information about the growth of the urban population in certain parts of the world including the prediction of the future.
22/07/2026 13:51 6.0 skor
Topik
The chart below gives information about the growth of the urban population in certain parts of the world including the prediction of the future.
Jumlah kata: 183
Grafik/Diagram
Essay
Skor Keseluruhan
6.0±0.5
Cukup
Skor Kriteria Writing
TA6.0
CC7.0
LR6.0
GRA6.0
Klik teks yang ditandai di esai untuk melihat saran detail untuk peningkatan.
Analisis mendalam
Task 1 - Academic Writing
4 tools available
Esai contoh - IELTS Writing Task 1
Belum ada esai contoh
Silakan klik tombol di bawah untuk menganalisis dan membuat esai contoh berkualitas tinggi untuk Task 1.