
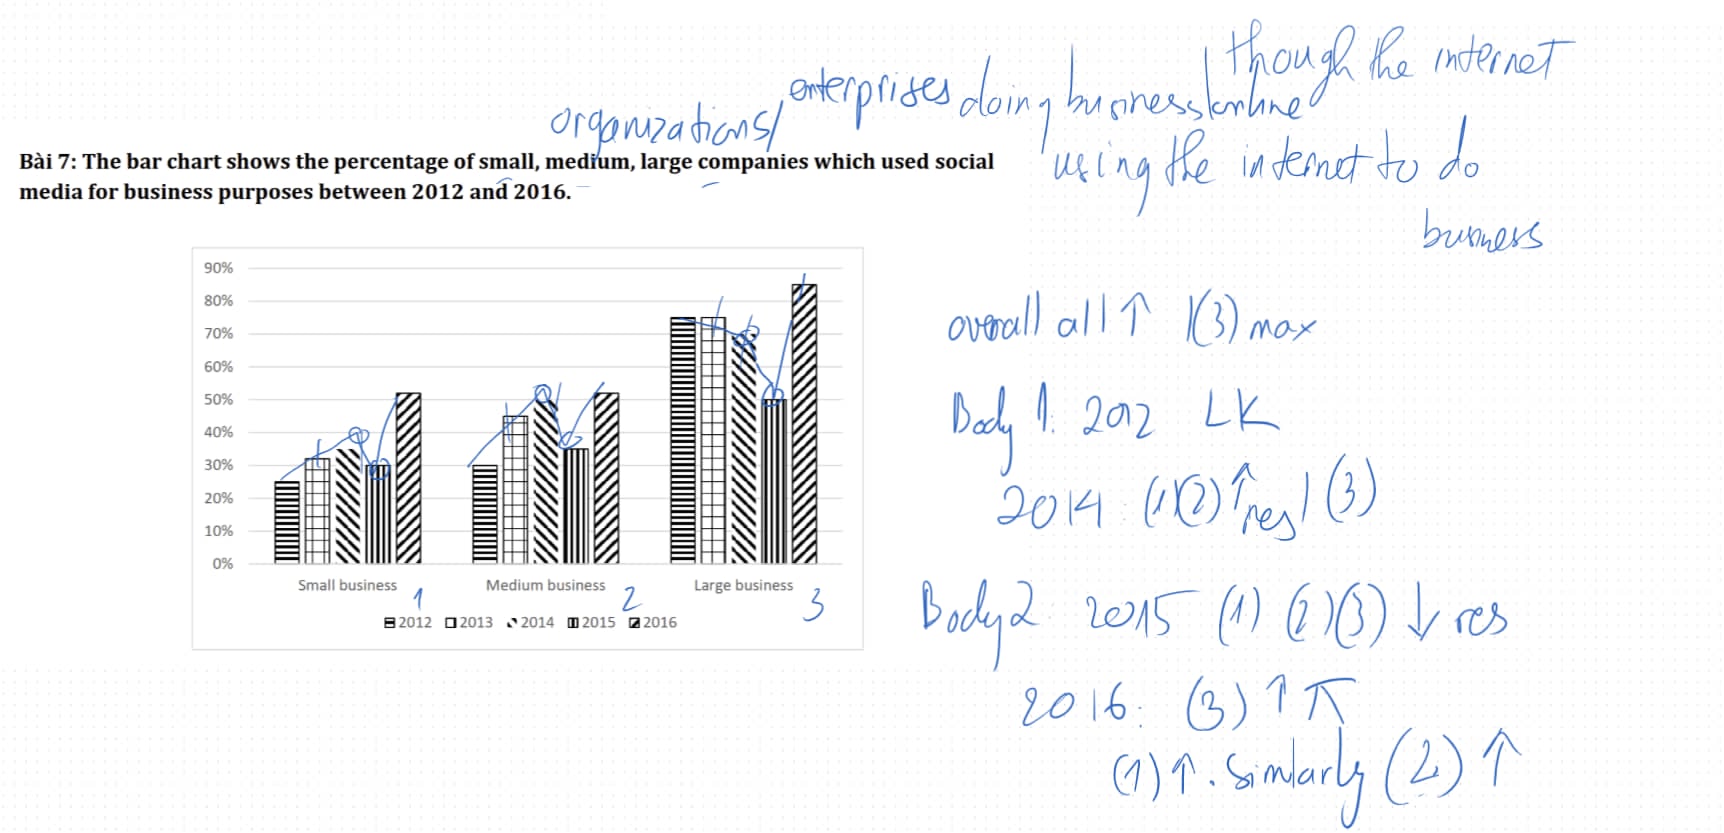
The bar graph compares the percentage of small ,medium,large organization which used social media for business purposes from 2012 to 2016. It is clear that the rate of large business was highest in the research period .At the same time , small and medium companies increased significantly. In the year 2012 , the rate of big business was highest ,at 75% ,while the proportion of medium organization was significant lower ,at 45% .By contrast , the percentage of small business was lowest ,at 25%.In 2014 witnessed increases in the rates of small and medium business to 35% and 50% respectively.Whereas there was a slightly declined in the percentage of large organization. In 2015 , the figures for small , medium and large companies were all decreases to 30%,35% and 50% respectively. In 2016 , the rate of large companies rose to reach a peak of 85% during the period. Meanwhile , the percentage of small organization was significantly grew to around 52%.Similarly , the proportion of medium business was climbed rapidly.
নমুনা বিস্তারিত
the bar chart shows the percentage of small ,medium , large companies which used social media for business purpose between 2012 and 2016
22/07/2026 14:01 5.5 স্কোর
টপিক বা বিষয়
the bar chart shows the percentage of small ,medium , large companies which used social media for business purpose between 2012 and 2016
শব্দ সংখ্যা: 171
চার্ট/গ্রাফ
Essay
সামগ্রিক স্কোর
5.5±0.5
প্রাথমিক
রাইটিং মানদণ্ড স্কোর
TA6.0
CC6.0
LR6.0
GRA5.0
উন্নতির জন্য বিস্তারিত পরামর্শ দেখতে প্রবন্ধের হাইলাইট করা যেকোনো লেখায় ক্লিক করুন।
গভীর বিশ্লেষণ
Task 1 - Academic Writing
4 tools available
নমুনা রচনা - IELTS Writing Task 1
কোনো নমুনা রচনা নেই
টাস্ক ১-এর জন্য উচ্চমানের নমুনা রচনা বিশ্লেষণ এবং তৈরি করতে নিচের বাটনে ক্লিক করুন।