
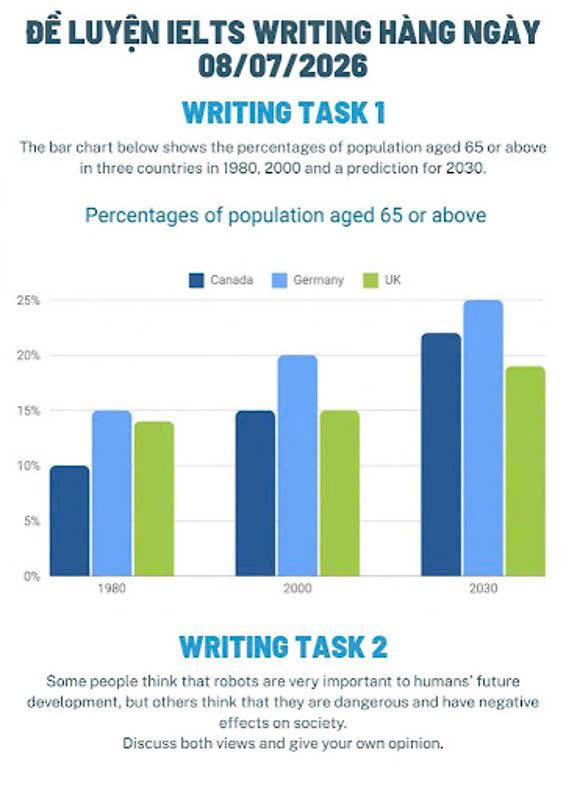
The provided bar chart compared the proportion of people aged 65 and over in three distinct national namely Canada, Germany, and the UK in 1980, 2000, including the forecast figures for 2030. Overall, the percentage of elderly people prediction to growth in all three countries, Germany has the highest proportion throughout the period. While Canada commences with the lowest figures but records the fastest increase. In 1980, Germany has the highest percentage at 15%, meanwhile Canada had the lowest figures, at exactly 10%. Middle by the UK with about 14%. From 1980 to 2000, Germany’s overtask the remain figures increase significantly to 20%. After rising slightly, Canada’s proportion reached 15% in 2000. There was a stable trend in the UK between 1980 and 2000, which followed dramatic growth in the following years. Looking at the forecast for 2030, Germany is prediction to level of the national with the leading the trend percentage of elderly people at 25%. Before reaching figures, its proportion saw increase steadily at 5% throughout the period and proportion had the highest of the remainder. Canada’s rate grew steadily, and then growth rapidly to 22% in 2030. By 2030, the UK’s figures increase slightly to nearly 20%, remaining lower than those of Germany and Canada.
नमूना विवरण
22/07/2026 14:01 5.5 अंक
विषय
शब्दों की संख्या: 208
चार्ट/ग्राफ
Essay
समग्र स्कोर
5.5±0.5
बुनियादी
राइटिंग मानदंड स्कोर
TA6.0
CC6.0
LR5.0
GRA6.0
सुधार के विस्तृत सुझाव देखने के लिए लेख में किसी भी हाइलाइट किए गए टेक्स्ट पर क्लिक करें।
गहन विश्लेषण
Task 1 - Academic Writing
4 उपकरण उपलब्ध
नमूना लेख - IELTS Writing Task 1
कोई नमूना लेख नहीं
Task 1 के लिए उच्च-गुणवत्ता वाला नमूना लेख विश्लेषण और बनाने के लिए नीचे दिए गए बटन पर क्लिक करें।