
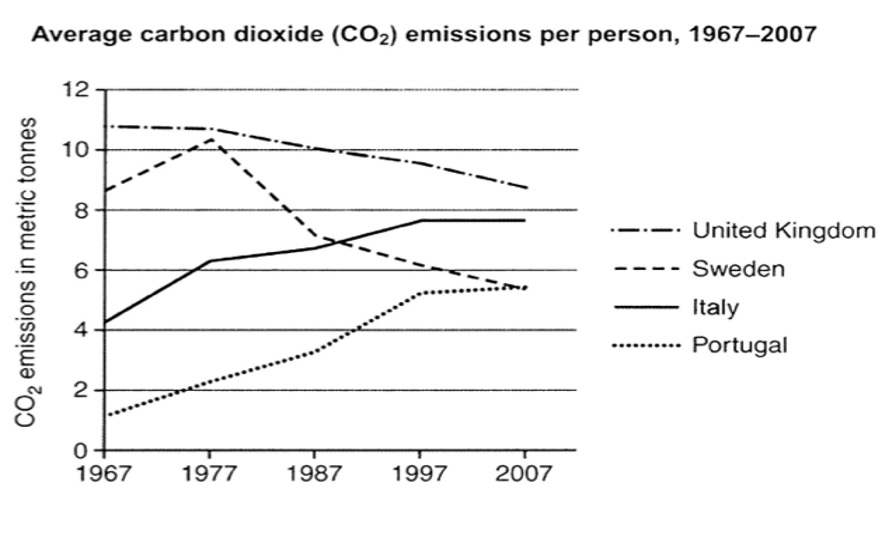
The provided chart illustrates the average carbon dioxide exhausts per person in the United Kingdom, Sweden, Italy and Portugal from 1967 to 2007. Overall, the two highest are the United Kingdom and Sweden showing a downward trend. In contrast, Italy and Portugal’s carbon emissions were lower but were trending upwards year by year. All in all, the United Kingdom was the highest in the given period. In the first ten years, the United Kingdom was the highest country. The amount of carbon dioxide emitted in the United Kingdom stabilised at nearly 11 metric tonnes. Then from 1987 to 2007, the average of CO2 was slightly declined to 9 metric tonnes. The carbon footprint in Sweden was over 10 and almost reached a peak of 11 tonnes in 1997, but steeply went down to 5.5 tonnes in 2007. Although both are trending downwards, they remain above the general level. In contrast, Italy’s CO2 emissions nearly doubled, starting at just above 4 metric tonnes in 1967 and ending at almost 8 metric tonnes four decades later; it showed an enormously rise in the level of greenhouse gas. Portugal’s CO2 emissions, however, nearly quadrupled. The per capita average in 1967 was just 1.5 metric tonnes, but in 2007, the emissions had reached 5.5 metric tonnes, matching Sweden's average.
नमूना विवरण
The graph below shows average carbon dioxide (Co2) emissions per person in the United Kingdom, Sweden, Italy, and Portugal between 1967 and 2007. Summarize the information by selecting and reporting the main features, and make comparisons where relevant. Write at least 150 words. Summarise the information by selecting and reporting the main features, and make comparisons where relevant.
22/07/2026 14:07 6.0 अंक
विषय
The graph below shows average carbon dioxide (Co2) emissions per person in the United Kingdom, Sweden, Italy, and Portugal between 1967 and 2007. Summarize the information by selecting and reporting the main features, and make comparisons where relevant. Write at least 150 words. Summarise the information by selecting and reporting the main features, and make comparisons where relevant.
शब्दों की संख्या: 215
चार्ट/ग्राफ
Essay
समग्र स्कोर
6.0±0.5
ठीक
राइटिंग मानदंड स्कोर
TA6.0
CC7.0
LR6.0
GRA6.0
सुधार के विस्तृत सुझाव देखने के लिए लेख में किसी भी हाइलाइट किए गए टेक्स्ट पर क्लिक करें।
गहन विश्लेषण
Task 1 - Academic Writing
4 उपकरण उपलब्ध
नमूना लेख - IELTS Writing Task 1
कोई नमूना लेख नहीं
Task 1 के लिए उच्च-गुणवत्ता वाला नमूना लेख विश्लेषण और बनाने के लिए नीचे दिए गए बटन पर क्लिक करें।