
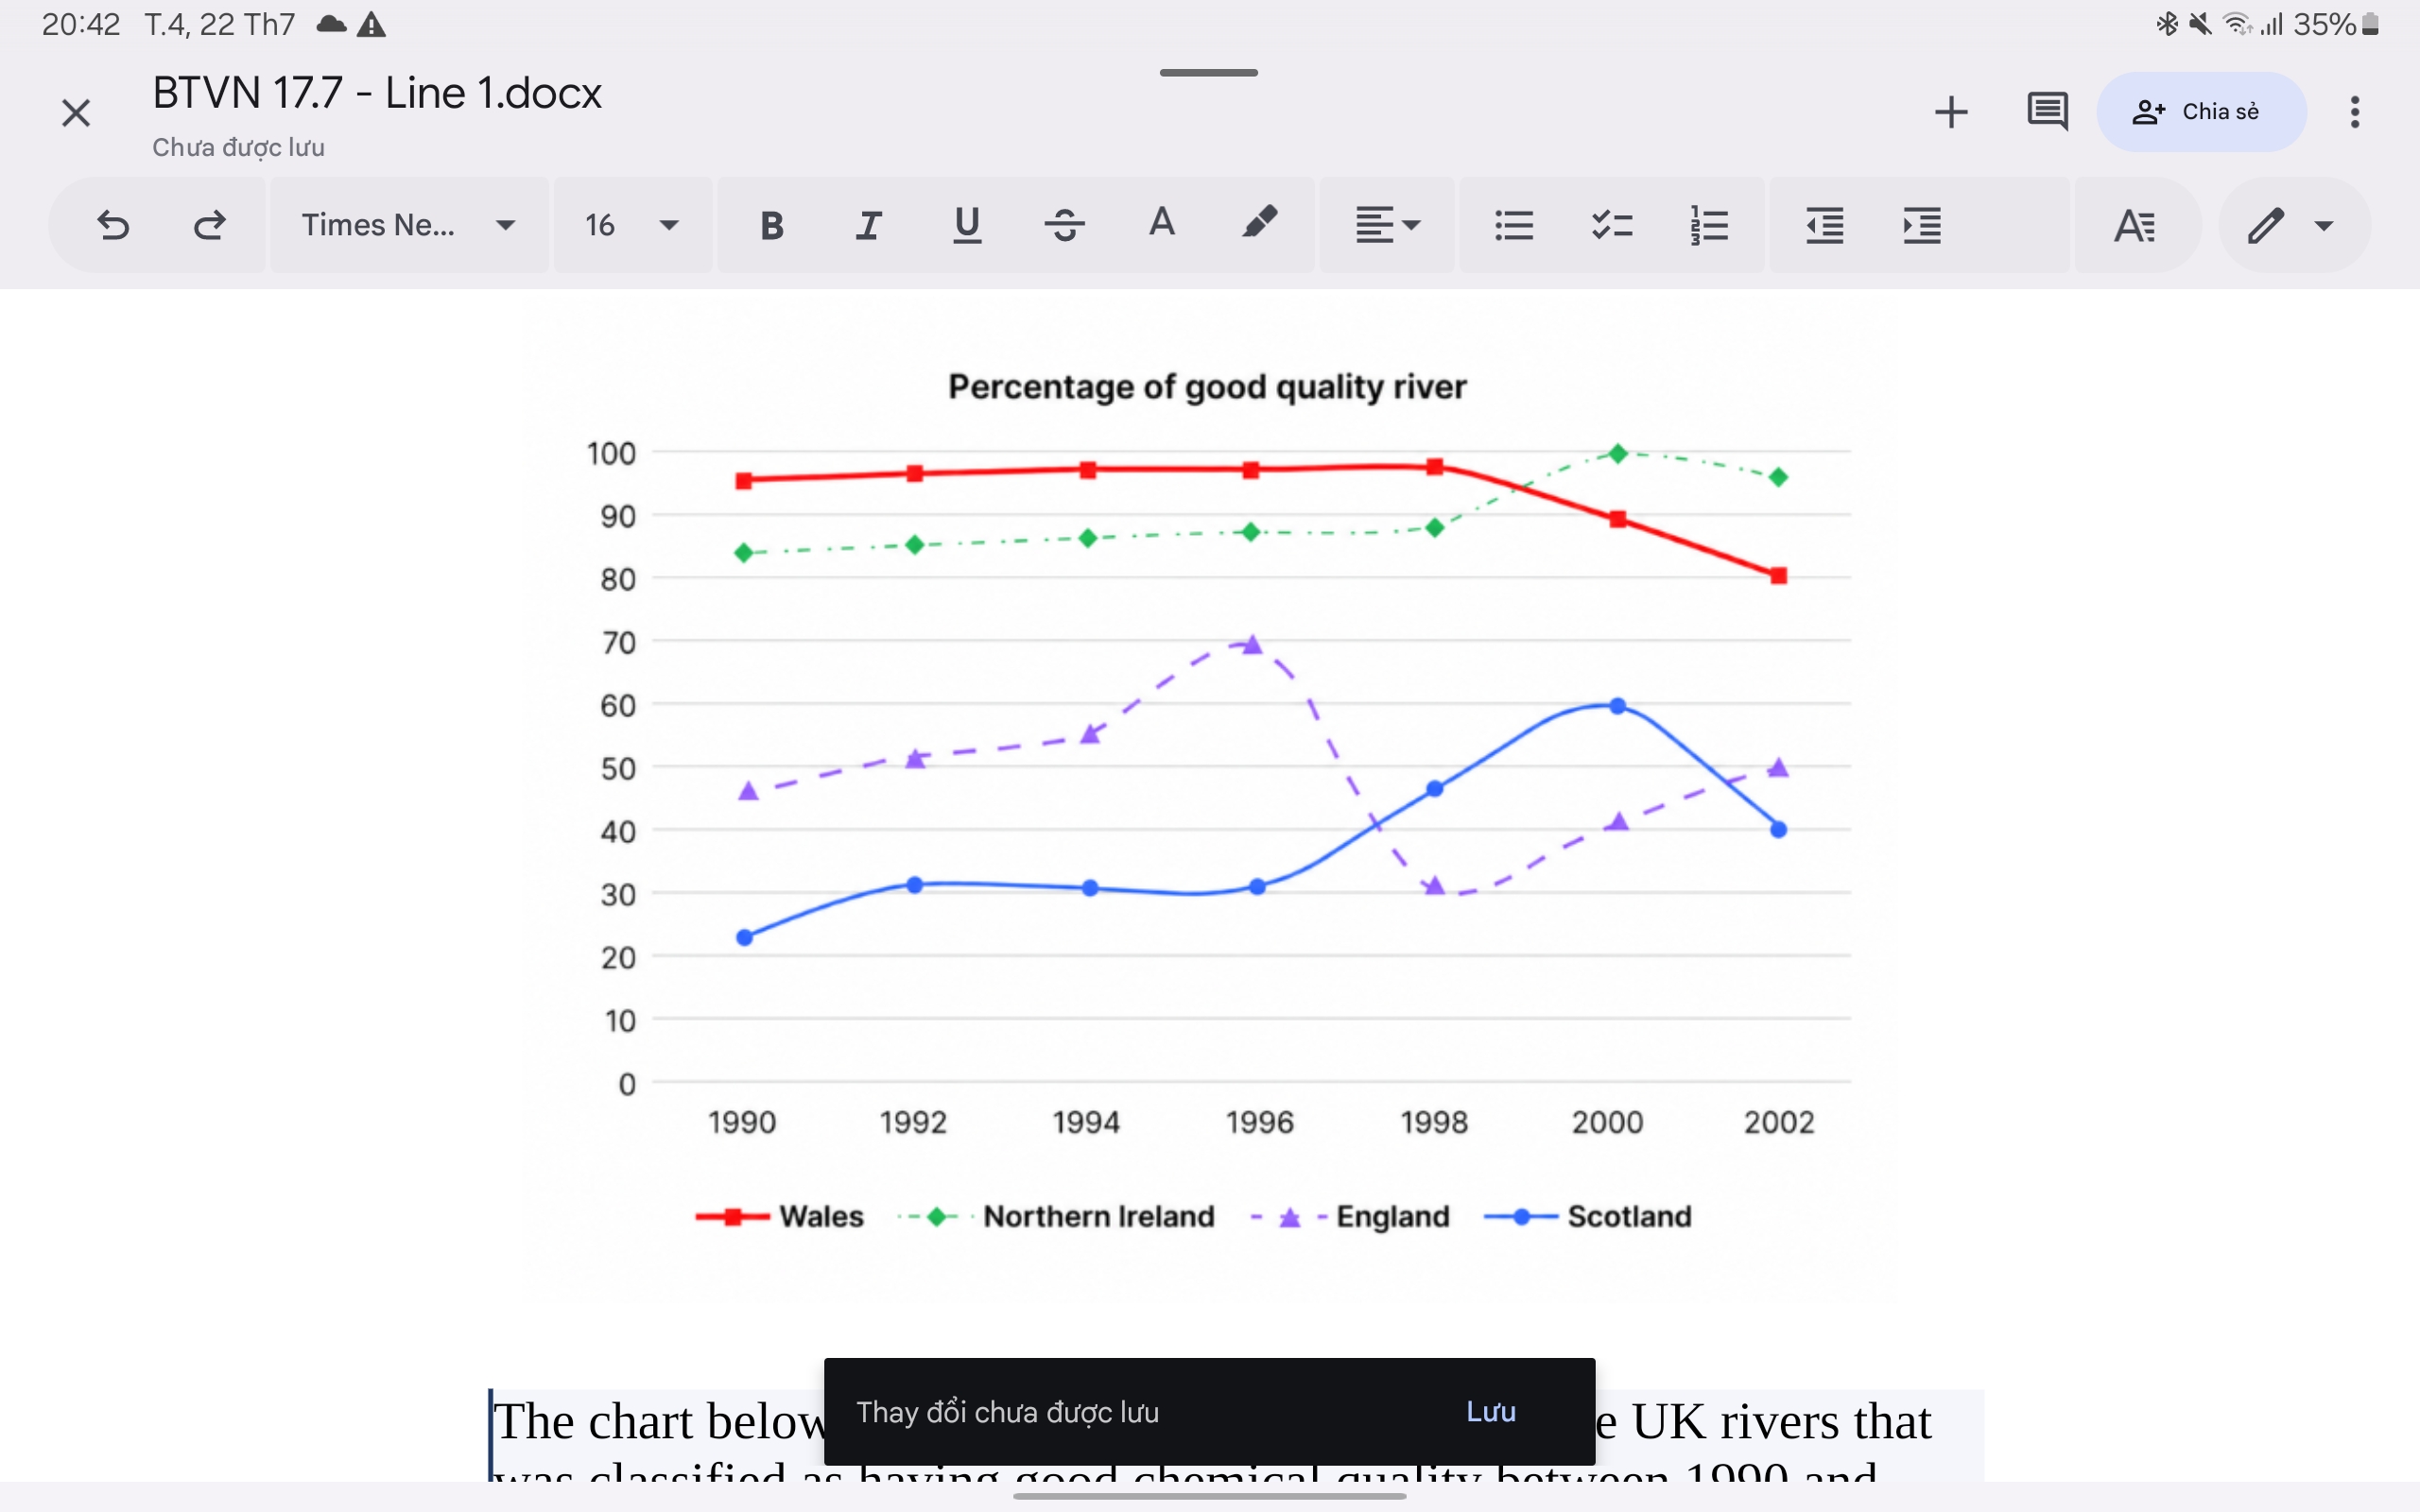
The line graph demonstrates the quality of water in UK rivers, including Wales, Northern Ireland, England, and Scotland, that was considered chemically satisfactory from 1990 to 2002. It is noticeable that rivers in Wales had by far the highest quality of the four types of river for the majority of the 8-year period. However, a considerable rise can be seen in the quality of Northern Ireland's rivers, which eventually overtook the Wales ones. Besides, there was fluctuation in England and Scotland throughout the period. Between 1990 and 1998, the percentage of qualified water in Northern Ireland's rivers rose by roundly 5%. Similarly, Wales also increased steadily and peaked at around 97%. While the figures for England experienced a sharp surge and maxed out at about 70% in 1996 before hitting a trough of 30% in 1998. By contrast, after climbing slightly, Scotland almost reached a plateau at about 30%, then eventually surpassed that of England to around 47%. Between 1990 and 1998, the percentage of qualified water in Northern Ireland's rivers rose by roundly 5%. Similarly, Wales also increased steadily and peaked at around 97%. While the figures for England experienced a sharp surge and maxed out at about 70% in 1996 before hitting a trough of 30% in 1998. By contrast, after climbing slightly, Scotland almost reached a plateau at about 30%, then eventually surpassed that of England to around 47%. By 2002, the valuable river in Northern Ireland suddenly overtook that of Wales and reached its maximum of 100% in the 2000s. In contrast, a downward trend in the quality of water in Wales' rivers had been seen since 1998, falling to 70% in 2002. Besides, Scotland's rivers underwent a considerable rise in good chemical quality and then reached its peak at about 60% in 2000. A gradual upturn in England was observed, from approximately 30% to a half of the graph.
Detail Sampel
The chart below shows the percentage of water in the UK rivers that was classified as having good chemical quality between 1990 and 2002. Summarise the information by selecting and reporting the main features, and make comparisons where relevant
22/07/2026 14:08 5.0 skor
Topik
The chart below shows the percentage of water in the UK rivers that was classified as having good chemical quality between 1990 and 2002. Summarise the information by selecting and reporting the main features, and make comparisons where relevant
Jumlah kata: 314
Grafik/Diagram
Essay
Skor Keseluruhan
5.0±0.5
Dasar
Skor Kriteria Writing
TA5.0
CC4.0
LR6.0
GRA6.0
Klik teks yang ditandai di esai untuk melihat saran detail untuk peningkatan.
Analisis mendalam
Task 1 - Academic Writing
4 tools available
Esai contoh - IELTS Writing Task 1
Belum ada esai contoh
Silakan klik tombol di bawah untuk menganalisis dan membuat esai contoh berkualitas tinggi untuk Task 1.