
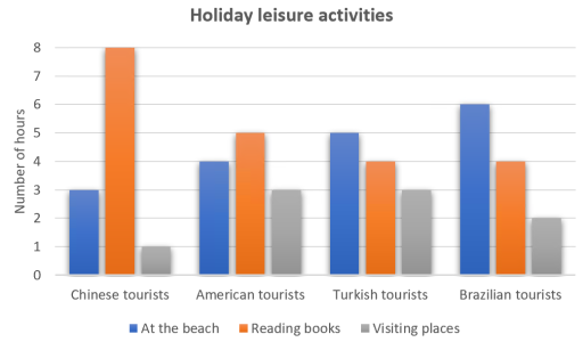
The given chart compares how many hours each day Chinese, American, Turkish and Brazil tourists spent on leisure activities in August in 2019. Overall, Chinese devoted by far the most time for reading, whereas Brazilian and Turkish visitors spent the greatest time relaxing at the beach. Notably, visiting places was the least popular activity compared with other categories. Delve into specifics, the number of hours Chinese tourists spend reading accounted for 8 hours, which was much higher than that of relaxing at the beach and visiting places with 3 hours and 1 hour in order. Regarding American tourists, reading was the most common activity with 5 hours, followed by the figures for relaxing at the beach and visiting places, 4 hours and 3 hours respectively. Turning to Turkish tourists, they preferred spending time at the beach where they stayed for 5 hours. Meanwhile, the average hours for reading constituted about 4 hours, while people took 3 hours to visit places. Similarly, Brazilian tourists spent the longest time at the beach at 6 hours. Finally, the number of hours for reading within 4 hours was much twice higher than that of visiting places.
รายละเอียดตัวอย่าง
Question 1: The chart shows the average number of hours each day that Chinese, American, Turkish and Brazilian tourists spent doing leisure activities while on holiday in Greece in August 2019.
22/07/2026 14:14 7.0 คะแนน
หัวข้อ
Question 1: The chart shows the average number of hours each day that Chinese, American, Turkish and Brazilian tourists spent doing leisure activities while on holiday in Greece in August 2019.
จำนวนคำ: 192
แผนภูมิ/กราฟ
Essay
คะแนนรวม
7.0±0.5
ดีมาก
คะแนนเกณฑ์การเขียน
TA8.0
CC8.0
LR6.0
GRA7.0
คลิกข้อความที่ไฮไลต์ในเรียงความเพื่อดูคำแนะนำรายละเอียดเพื่อพัฒนา
การวิเคราะห์เชิงลึก
Task 1 - Academic Writing
4 tools available
บทความตัวอย่าง - IELTS Writing Task 1
ยังไม่มีบทความตัวอย่าง
กดปุ่มด้านล่างเพื่อวิเคราะห์และสร้างบทความตัวอย่างคุณภาพสูงสำหรับ Task 1