
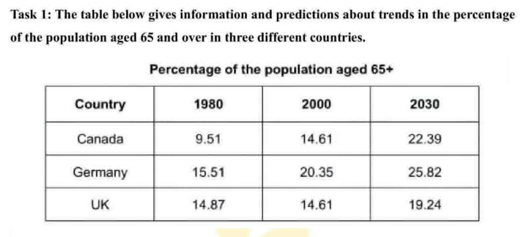
The table chart illustrate information and predictions about trends in the proportion of the population aged 65 and over in Canada, Germany and UK in 1980, 2000 and 2030. Overall, the percentage of elderly people predicted increase in three different countries. Germany has the highest figure every year, while Canada starts the lowest figure but shows the biggest increase. In 1980, Germany had the highest percentage of people aged 65 and over, at 15.51%. Canada had the lowest proportion of 9.51%, while the UK followed at 14.87%. By 2000, Germany still the highest figure in three contries, with 20.35%. The UK and Canada the same proportion at 14.61%. In 2030, all three countries are predicted to have higher percentage. Germany still continue inscrease with the highest figure at 25.82%. Canada is expected rise significantly at 22.39%, while the UK will increase with 19.24%. Canada will have to the largest growth on whole period.
Detail Sampel
The table below gives information and predictions about trends in the percentage of the population aged 65 and over in three different countries.
22/07/2026 14:25 5.5 skor
Topik
The table below gives information and predictions about trends in the percentage of the population aged 65 and over in three different countries.
Jumlah kata: 153
Grafik/Diagram
Essay
Skor Keseluruhan
5.5±0.5
Dasar
Skor Kriteria Writing
TA6.0
CC6.0
LR5.0
GRA5.0
Klik teks yang ditandai di esai untuk melihat saran detail untuk peningkatan.
Analisis mendalam
Task 1 - Academic Writing
4 tools available
Esai contoh - IELTS Writing Task 1
Belum ada esai contoh
Silakan klik tombol di bawah untuk menganalisis dan membuat esai contoh berkualitas tinggi untuk Task 1.