
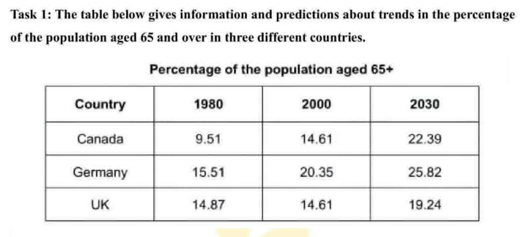
The table chart illustrate information and predictions about trends in the proportion of the population aged 65 and over in Canada, Germany and UK in 1980, 2000 and 2030. Overall, the percentage of elderly people predicted increase in three different countries. Germany has the highest figure every year, while Canada starts the lowest figure but shows the biggest increase. In 1980, Germany had the highest percentage of people aged 65 and over, at 15.51%. Canada had the lowest proportion of 9.51%, while the UK followed at 14.87%. By 2000, Germany still the highest figure in three contries, with 20.35%. The UK and Canada the same proportion at 14.61%. In 2030, all three countries are predicted to have higher percentage. Germany still continue inscrease with the highest figure at 25.82%. Canada is expected rise significantly at 22.39%, while the UK will increase with 19.24%. Canada will have to the largest growth on whole period.
Sample Detail
The table below gives information and predictions about trends in the percentage of the population aged 65 and over in three different countries.
22/07/2026 14:25 5.5 points
Topic
The table below gives information and predictions about trends in the percentage of the population aged 65 and over in three different countries.
Word count: 153
Chart/Graph
Essay
Overall Scores
5.5±0.5
Basic
Writing Criteria Scores
TA6.0
CC6.0
LR5.0
GRA5.0
Click on any highlighted text in the essay to view detailed suggestions for improvement.
Deep Analysis
Task 1 - Academic Writing
4 tools available
Sample Essay - IELTS Writing Task 1
No sample essay
Click the button below to analyze and generate a high-quality sample essay for Task 1.