
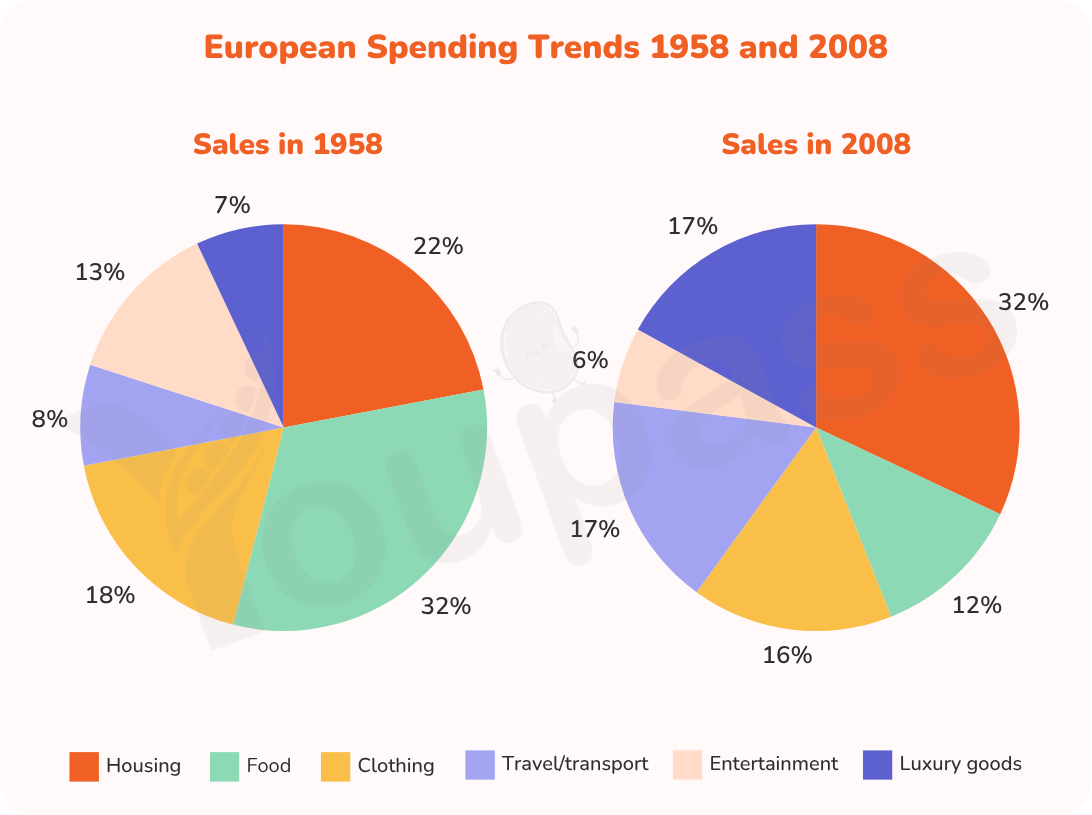
The given illustrations compare total expenditures on various fields and necessities by citizens in a European nation between 1958 and 2008. In brief, while spending patterns for housing, luxurious products and transportation experienced an upward trajectory, an opposing tendency was seen in eating, clothing and entertaining aspects. Noticeably, while food was clearly the most common commodity to spend on in 1958, citizens in 2008 were the most likely to pay for housing costs. Regarding three rising figures, the metric for accommodations climbed to 32% in 2008, which was 10% higher than its proportion in 1958, taking the leading position from food. Furthermore, in 2008, spending on transportation and luxury products were virtually identical, accounting for 17%, while the corresponding figures for those expenses in 1958 were remarkably lower at 7% and 8%, respectively. Turning to categories experiencing a downward trend, despite recording the largest proportion in 1958 (32%), the metric for food declined by 20 percentage points after 50 years. Similarly, but to a lesser extent, the proportion of clothing dipped from 18% in 1958 to 16% in 2008. Moreover, a declining trajectory was also observed in the figure for entertainment, which fell from 13% in 1958 to 6% in 2008.
Sample Detail
The charts below show the proportion of people’s total spending in a particular European country was spent on different commodities and services in 1958 and in 2008. Summarise the information by selecting and reporting the main features, and make comparisons where relevant.
22/07/2026 14:30 8.0 points
Topic
The charts below show the proportion of people’s total spending in a particular European country was spent on different commodities and services in 1958 and in 2008. Summarise the information by selecting and reporting the main features, and make comparisons where relevant.
Word count: 201
Chart/Graph
Essay
Overall Scores
8.0±0.5
Excellent
Writing Criteria Scores
TA8.0
CC8.0
LR8.0
GRA8.0
Click on any highlighted text in the essay to view detailed suggestions for improvement.
Deep Analysis
Task 1 - Academic Writing
4 tools available
Sample Essay - IELTS Writing Task 1
No sample essay
Click the button below to analyze and generate a high-quality sample essay for Task 1.