
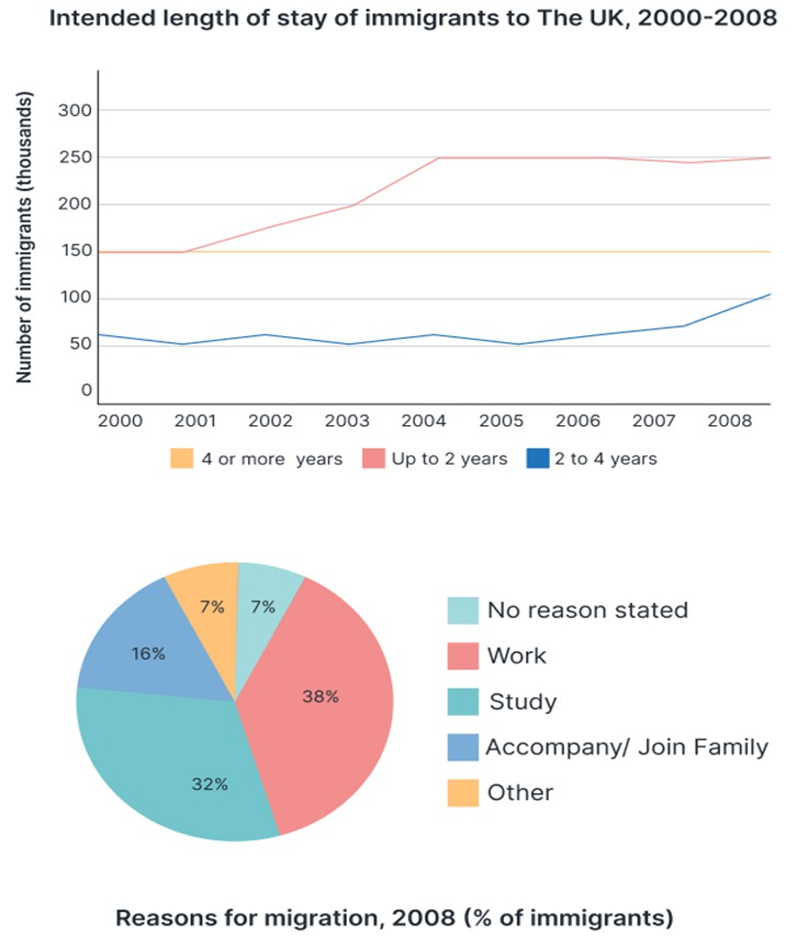
The given graph and pie chart provide information regarding immigration to the United Kingdom. The line graph illustrates the time immigrants intended to stay in the UK from 2000 to 2008, while the pie chart depicts reasons for immigration in 2008. Overall, on the line graph, there were notable differences in the duration of stay among migrants, people stayed up to 2 years make up the biggest over the period. In contrast, migrants who stayed 2 to 4 years were the lowest of all time. Meanwhile, the pie chart reveals that work and study were the 2 primary purposes for migration to the UK in 2008. Looking first at the line graph, 4 or more years remained unchanged at 150 thousand over the period. Up to 2 years bracket experienced a significant growth in immigrants, starting at just 150 thousand people to approximately 250 thousand and becoming the highest figure by 2008. While migrants who stayed from 2 to 4 years fluctuated slightly around 50 to 60 thousand, before gradually rose to around 100 thousand by the end of the period. Coming to reasons for migration, work and study were by far the two dominant reasons for migration in 2008, accounting for 38% and 32% of the total, respectively. Together, these two categories made up 70% of the figure. Conversely, the remaining reasons were considerably less common. Accompanying or joining family represented 16%, while other reasons and no reason stated each accounted for 7% making them the least significant categories.
Detail Sampel
The graph and chart below give information about migration to the UK. The graph below shows how long immigrants in the year 2000-2008 intended to stay in the UK. The pie chart shows reasons for migration in 2008.
22/07/2026 14:40 7.0 skor
Topik
The graph and chart below give information about migration to the UK. The graph below shows how long immigrants in the year 2000-2008 intended to stay in the UK. The pie chart shows reasons for migration in 2008.
Jumlah kata: 250
Grafik/Diagram
Essay
Skor Keseluruhan
7.0±0.5
Baik
Skor Kriteria Writing
TA7.0
CC7.0
LR7.0
GRA7.0
Klik teks yang ditandai di esai untuk melihat saran detail untuk peningkatan.
Analisis mendalam
Task 1 - Academic Writing
4 tools available
Esai contoh - IELTS Writing Task 1
Belum ada esai contoh
Silakan klik tombol di bawah untuk menganalisis dan membuat esai contoh berkualitas tinggi untuk Task 1.