
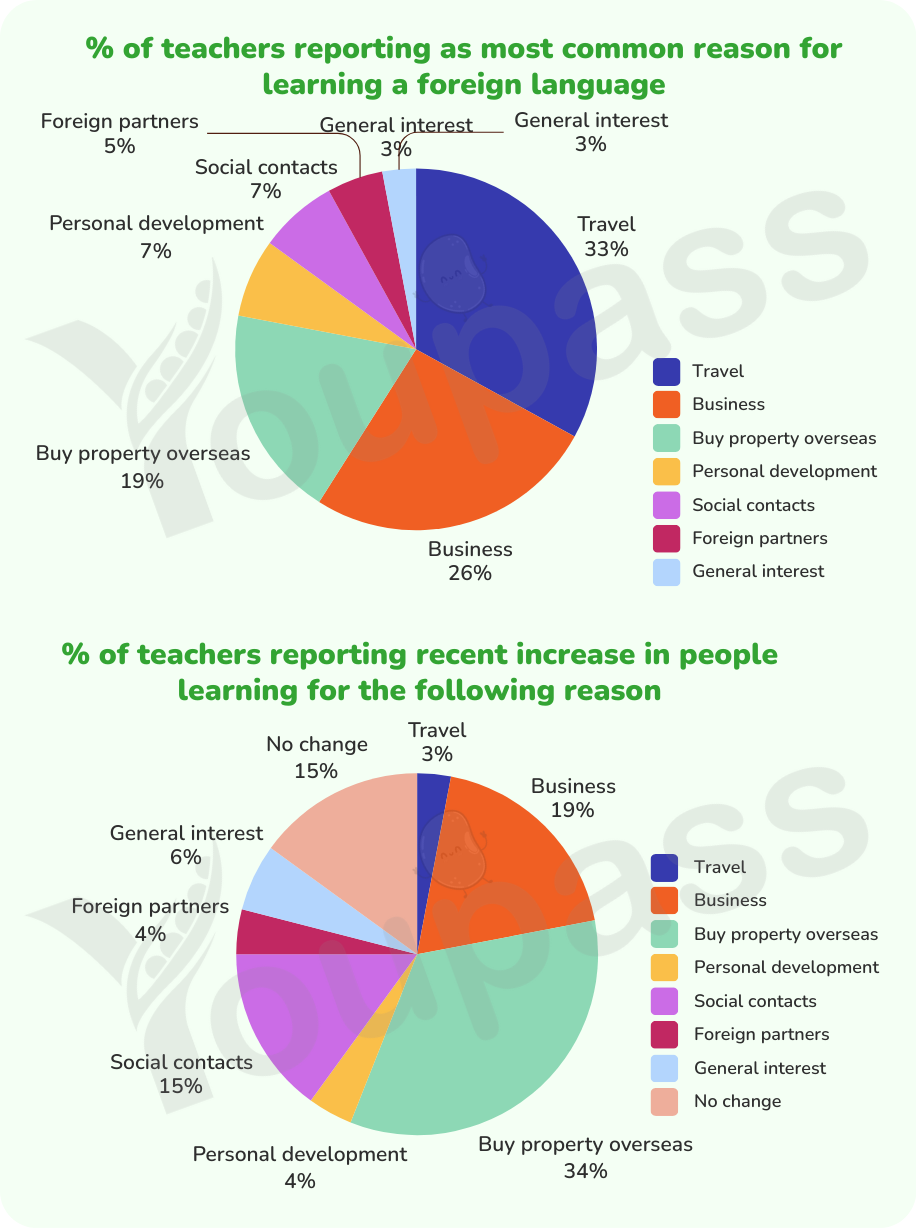
The pie charts illustrate the British survey responses for teacher about the different motivations of learning a foreign language. The first chart shows the proportion of teacher reporting various main reasons, the second indicates the figure for those believe there has been a recent growth. Overall, the travel rate consitituted the highest figure in the first chart while its data almost disappered in the second graph. In contrast, the share of buying property overseas reason, which has stood at the third ranking, took the lead among other following categories. Turning to the first survey, travel contributed the most to the entire sector, accounted for 33%, followed by business and buying property abroad, recorded at 26% and 19%, respectively. The second pie graph indicated 3% in travel, which became the least notably reason for growth. The similar trend was true for business at 19%. Conversely, the figure for abroad property investment made up the largest of all data, generating 34%. Regarding the smaller group, personal development and social contacts each represented 7%, while foreign partners and general interest comprised only 5% and 3%, respectively. In the second chart, social contacts and no change each accounted for 15% while general interest stood at 6%, personal development and foreign partners at 4% each, and travel recording the smallest share of just 3%.
รายละเอียดตัวอย่าง
The pie charts below show responses by teachers of foreign languages in Britain to a survey concerning why their students are learning a foreign language. The first chart shows the main reasons for learning a foreign language, the second chart shows how many teachers felt that there have been a recent change in the reason. Write a report for university lecturer describing the information below.
22/07/2026 14:43 6.5 คะแนน
หัวข้อ
The pie charts below show responses by teachers of foreign languages in Britain to a survey concerning why their students are learning a foreign language. The first chart shows the main reasons for learning a foreign language, the second chart shows how many teachers felt that there have been a recent change in the reason. Write a report for university lecturer describing the information below.
จำนวนคำ: 219
แผนภูมิ/กราฟ
Essay
คะแนนรวม
6.5±0.5
ดีพอใช้
คะแนนเกณฑ์การเขียน
TA7.0
CC7.0
LR6.0
GRA6.0
คลิกข้อความที่ไฮไลต์ในเรียงความเพื่อดูคำแนะนำรายละเอียดเพื่อพัฒนา
การวิเคราะห์เชิงลึก
Task 1 - Academic Writing
4 tools available
บทความตัวอย่าง - IELTS Writing Task 1
ยังไม่มีบทความตัวอย่าง
กดปุ่มด้านล่างเพื่อวิเคราะห์และสร้างบทความตัวอย่างคุณภาพสูงสำหรับ Task 1