
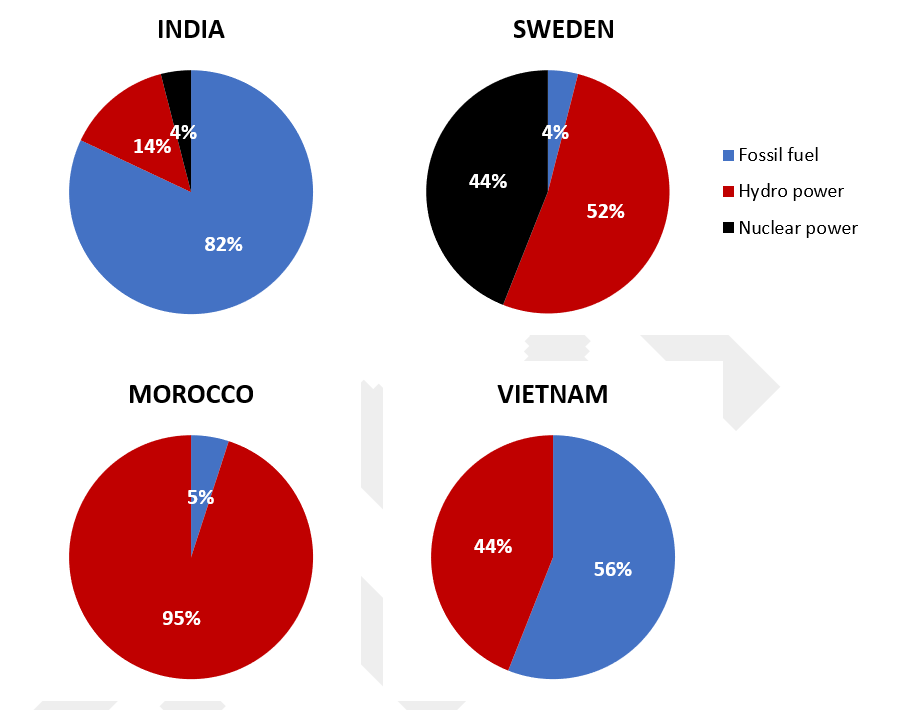
The pie charts compare the source of electricity generated by distinct powers in four different countries between 2003 and 2008. Overall, it is clear that Morocco and Vietnam did not use nuclear power as the materials to produce electricity. Additionally, while exhibiting a significant proportion in Vietnam and India, fossil fuel only occupied a margin share in the the total of Morocco and Sweden. Regarding the nations not using nuclear power, the majority of electricity generated in Morocco was considerably made up by hydro power with 95% while only 5% from fossil fuel. Meanwhile, those in Vietnam were distributed more evenly with 44% from hydro power and over a half of total from fossil fuel. Turning to the other nations, in India, the most electricity was produced from fossil fuel at 85% while the highest source of electricity in Sweden was from hydro power. At the same proportion, 4% of nuclear power in the former nation and 4% in the later nation was used in generating electricity. Finally, hydro power originating from India and nuclear power from Sweden accounted for 14% and 44%, respectively.
Detail Sampel
The charts show the sources of electricity produced in 4 countries between 2003 and 2008.Summarise the information by selecting and reporting the main features, and make comparisons where relevant
22/07/2026 14:49 6.0 skor
Topik
The charts show the sources of electricity produced in 4 countries between 2003 and 2008.Summarise the information by selecting and reporting the main features, and make comparisons where relevant
Jumlah kata: 184
Grafik/Diagram
Essay
Skor Keseluruhan
6.0±0.5
Cukup
Skor Kriteria Writing
TA6.0
CC6.0
LR6.0
GRA6.0
Klik teks yang ditandai di esai untuk melihat saran detail untuk peningkatan.
Analisis mendalam
Task 1 - Academic Writing
4 tools available
Esai contoh - IELTS Writing Task 1
Belum ada esai contoh
Silakan klik tombol di bawah untuk menganalisis dan membuat esai contoh berkualitas tinggi untuk Task 1.