
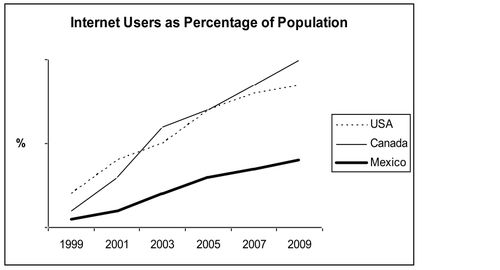
The line graph compare and contrast data on the numer of people using the Internet in three different countries, USA, Canada, and Mexico between 1999 and 2009. A closer look at the diagram highlights the fact that all three countries experienced an upward trend in the percentage of Internet users, and a much larger percentage of Canadians and Americans had access to the Internet in comparison with Mexicans. In 1999, the proportion of Internet users are the highest among the three countries, which was about 20 percent, while the figures for Canada and the Mexico were lower, at about 10 percent and 5 percent, respectively. In 2005, Internet usage in the USA and Canada steadily increased to about 70 percent, while the figure for Mexico only reached just over 25 percent. By 2009, the percentage of Internet users was highest in Canada. Almost 100% of Canadians used the Internet, compared to about 80% of Americans and only 40% of Mexicans.
รายละเอียดตัวอย่าง
The graph shows the percentage of Internet users in three countries from 1999 to 2009. Summarize the information by selecting and reporting the main features, and make comparisons where relevant. Write at least 150 words.
22/07/2026 14:51 6.0 คะแนน
หัวข้อ
The graph shows the percentage of Internet users in three countries from 1999 to 2009. Summarize the information by selecting and reporting the main features, and make comparisons where relevant. Write at least 150 words.
จำนวนคำ: 160
แผนภูมิ/กราฟ
Essay
คะแนนรวม
6.0±0.5
ดีพอใช้
คะแนนเกณฑ์การเขียน
TA6.0
CC6.0
LR6.0
GRA6.0
คลิกข้อความที่ไฮไลต์ในเรียงความเพื่อดูคำแนะนำรายละเอียดเพื่อพัฒนา
การวิเคราะห์เชิงลึก
Task 1 - Academic Writing
4 tools available
บทความตัวอย่าง - IELTS Writing Task 1
ยังไม่มีบทความตัวอย่าง
กดปุ่มด้านล่างเพื่อวิเคราะห์และสร้างบทความตัวอย่างคุณภาพสูงสำหรับ Task 1