
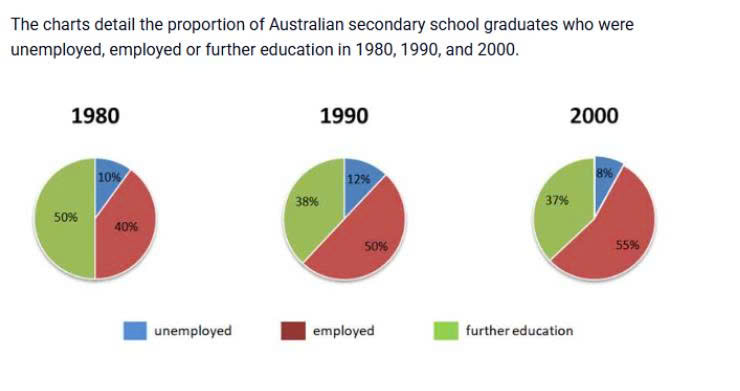
The pie charts illustrate the percentages of secondary-school graduates students in Australia who were jobless, working and continuing their studies in three different years: 1980, 1990, and 2000 Overall, the figures for employed students constituted the largest share in the majority years. Following this trend, the percentage of those pursuing further education generally held the second-largest, except for the first year when it was the largest. By contrast, the number of unemployed students ranked last throughout the years. In 1980, the figure for further education students was at its peak of 50%, students who have a job recorded at 40%. Unemployment students had the lowest proportion, reaching just 10%. The proportion in 1990 and 2000 followed similar patterns. Employed students accounted for the highest percentages, with 50% and 55% respectively. The students who pursued further education remained relatively stable with the second-largest proportion at 38% in 1990 then slightly dropped to 37% in 2000. There was a downward trend among those unemployed graduates, the data in 1990 stood at 12% but decreased to only 8% in 2000.
Detail Sampel
The charts detailed the proprtion of Australian secondary school graduates who were unemployed, employed and futher aducation.
22/07/2026 15:03 6.5 skor
Topik
The charts detailed the proprtion of Australian secondary school graduates who were unemployed, employed and futher aducation.
Jumlah kata: 177
Grafik/Diagram
Essay
Skor Keseluruhan
6.5±0.5
Cukup
Skor Kriteria Writing
TA7.0
CC7.0
LR6.0
GRA6.0
Klik teks yang ditandai di esai untuk melihat saran detail untuk peningkatan.
Analisis mendalam
Task 1 - Academic Writing
4 tools available
Esai contoh - IELTS Writing Task 1
Belum ada esai contoh
Silakan klik tombol di bawah untuk menganalisis dan membuat esai contoh berkualitas tinggi untuk Task 1.