
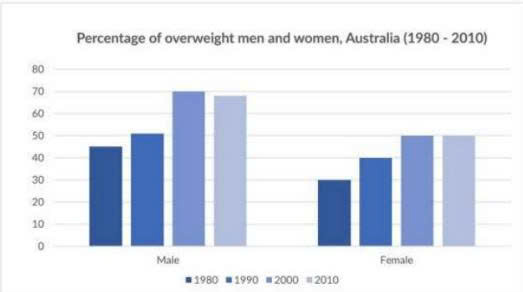
The bar given graph shows the percentage of overweight men and women in Australia since 1980 to 2010. Overall, percentage overweight of men was significantly higher over time as compared to female and finished highest between them . This shows men are generally over the weight than female. Eventhough, female percentage of overweight was low but it is significantly rose. In 1980, men started at around 45 percent which reached a peak of 70 percent in year 2000 but eventually decreased to around 67 percent in final year 2010 which is much more higher than female. In contrast, Female had a rising trend from initial to final year. It started at 30 percent in year 1980 which reached its highest of 50 percent in year 2000 and levelled of in year 2010. This surveys that men are more overweighted than female in Australia but both female and men have rising trend and both eventually rose
Sample Detail
The chart gives information about the percentage of overweight men and women in Australian from 1980-2010
22/07/2026 15:04 5.5 points
Topic
The chart gives information about the percentage of overweight men and women in Australian from 1980-2010
Word count: 155
Chart/Graph
Essay
Overall Scores
5.5±0.5
Basic
Writing Criteria Scores
TA6.0
CC6.0
LR5.0
GRA5.0
Click on any highlighted text in the essay to view detailed suggestions for improvement.
Deep Analysis
Task 1 - Academic Writing
4 tools available
Sample Essay - IELTS Writing Task 1
No sample essay
Click the button below to analyze and generate a high-quality sample essay for Task 1.