
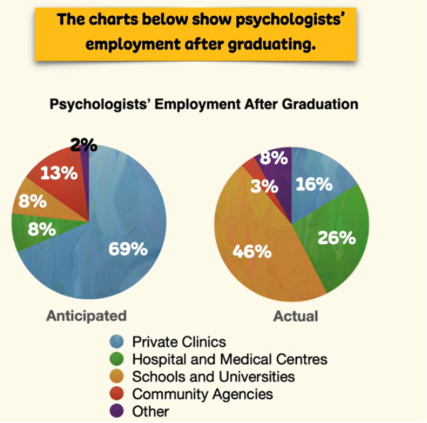
The pie charts illustrate the expected and factual occupations of psychology learners after course completion in terms of five categories. Overall, it is evident that private clinics account for the largest proportion in anticipated employment, while most psychologists opt for school and universities in reality. In addition, there is a disparity between predicted and actual figures. Regarding expected jobs, the percentage of private clinics is the most common employment for psychologists after finishing the course, recording 69%, significantly higher than the other fields. Additionally, community agencies also represent a primary rate with 13 percent. Meanwhile, comparable data is witnessed in the figure for healthcare centers and educational institutions, each at 8%. Finally, some unidentified categories make up just 2% Moving to factual employment, the rate for schools and universities consists of nearly half of the pie chart (46 percent), 20 percent higher than that for hospitals and medical centers. Moreover, psychology students just choose 8% in unnamed fields, two times fewer than private clinics. The share of community agencies recorded the lowest data, with only 3% of students engaging.
รายละเอียดตัวอย่าง
The charts below show psychologists' employment after graduating. Summarize the information by selecting and reporting the main features and make comparisons where relevant.
22/07/2026 15:16 7.0 คะแนน
หัวข้อ
The charts below show psychologists' employment after graduating. Summarize the information by selecting and reporting the main features and make comparisons where relevant.
จำนวนคำ: 179
แผนภูมิ/กราฟ
Essay
คะแนนรวม
7.0±0.5
ดีมาก
คะแนนเกณฑ์การเขียน
TA7.0
CC7.0
LR7.0
GRA7.0
คลิกข้อความที่ไฮไลต์ในเรียงความเพื่อดูคำแนะนำรายละเอียดเพื่อพัฒนา
การวิเคราะห์เชิงลึก
Task 1 - Academic Writing
4 tools available
บทความตัวอย่าง - IELTS Writing Task 1
ยังไม่มีบทความตัวอย่าง
กดปุ่มด้านล่างเพื่อวิเคราะห์และสร้างบทความตัวอย่างคุณภาพสูงสำหรับ Task 1