
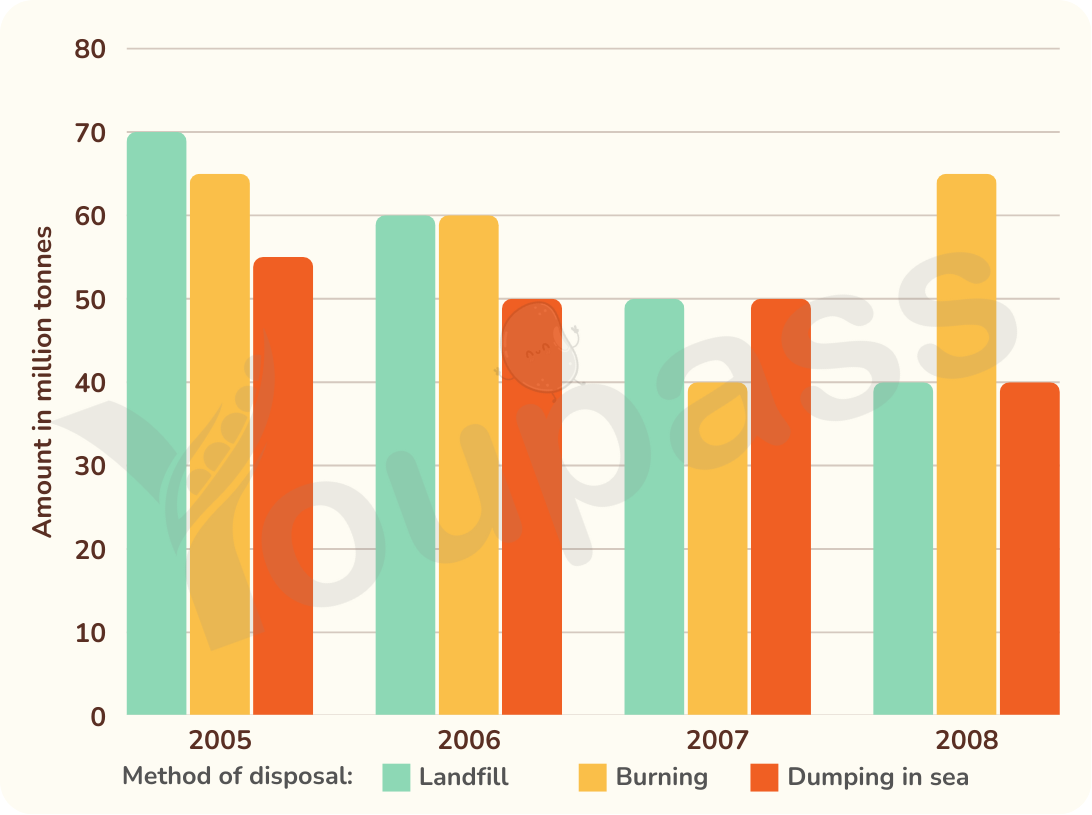
The bar chart provides data regarding various waste treatment methods in a European country between 2005 and 2008. Overall, the volume of waste processed by the two methods including landfill and dumping in sea tent to experienced downward trends, while the remaining way also decreased but in the first three years, then significantly rose in the end of the period, becoming the method that managed the highest volume of waste in 2008. In 2005, the quantity of waste that ended up in landfill was about 70 tonnes, while that processed by ocean dumping was around 55 tonnes. In 2006, both quanitities of waste removed by the two mentioned methods decreased, with figures being about 60 tonnes for landfill and 50 tonnes for dumping in sea. In 2007, the volume of waste buried dipped to roughly 50%, while that managed by ocean dumping stayed unchanged. Eventually, both numbers fell to approximately 40 tonnes in 2008. Burning method followed a similar trend, where the volume dropped from roughly 65 tonnes in 2005 to 60 tonnes in 2006, then to 40 tonnes in 2007. However, in 2008, the number significantly recovered to the same point as in 2005.
Sample Detail
The chart below shows different methods of waste disposal in a European country from 2005 to 2008. Summarise the information by selecting and reporting the main features, and make comparisons where relevant.
22/07/2026 15:19 6.0 points
Topic
The chart below shows different methods of waste disposal in a European country from 2005 to 2008. Summarise the information by selecting and reporting the main features, and make comparisons where relevant.
Word count: 195
Chart/Graph
Essay
Overall Scores
6.0±0.5
Fair
Writing Criteria Scores
TA6.0
CC7.0
LR5.0
GRA6.0
Click on any highlighted text in the essay to view detailed suggestions for improvement.
Deep Analysis
Task 1 - Academic Writing
4 tools available
Sample Essay - IELTS Writing Task 1
No sample essay
Click the button below to analyze and generate a high-quality sample essay for Task 1.