
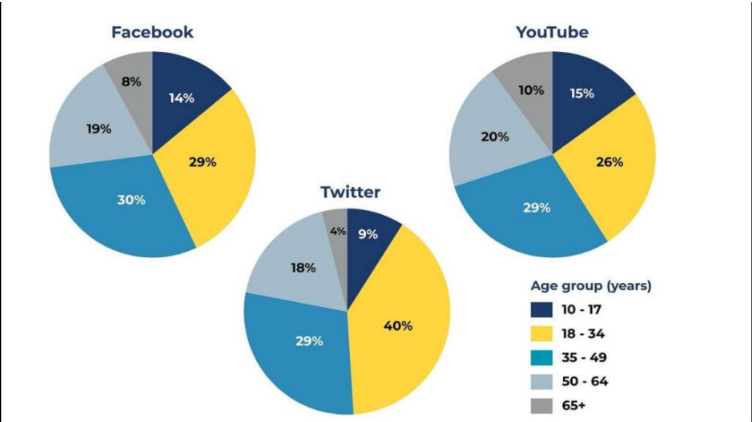
The given pie charts compare the proportions share of users in five different age groups across three social media platforms, namely Facebook, Youtube and Twitter. From an overall perspective, the 18-34 age group represents the largest proportion for Youtube and Facebook, while users aged 65 and above consistently represent remains the smallest share through all apps. It is also worth noting that group the 35-49 age group accounts for relatively similar percentages across all three apps. Facebook shows a relatively distribution among the main working-age group. The largest share of users is 30% in the 35-49 group, followed by 29% in the 18-34 group. A fairly smaller segment is users aged 50-64, at 14%. Older users and teenagers make up small shares, with 8% and 14%, respectively. Turing to Youtube, the age distribution is even more balanced among all the age groups. Users aged 35–49 account for the highest percentage at 29%, followed closely by those aged 18–34 at 26%. Older adults account for 20% of users aged 50–64 and only 10% of those aged 65 and above. Teenagers make up a slightly larger share on YouTube than on Facebook, at 15%. In contrast, users aged 18-34 dominate the Twitter’s user base at 40%, which is also the highest percentage for this age group across the three platforms. This figure is considerably higher than that of those for 35-49 group at 29%, followed by users aged 50-64 at 18%. Teenagers and senior users account for relatively small shares at 9% and 4%, respectively.
รายละเอียดตัวอย่าง
Question 2: The pie charts show the proportion of users across different age groups on three apps: Twitter, Facebook and Youtube. Summarise the information by selecting and reporting the main features, and make comparisons where relevant.
22/07/2026 15:22 6.5 คะแนน
หัวข้อ
Question 2: The pie charts show the proportion of users across different age groups on three apps: Twitter, Facebook and Youtube. Summarise the information by selecting and reporting the main features, and make comparisons where relevant.
จำนวนคำ: 253
แผนภูมิ/กราฟ
Essay
คะแนนรวม
6.5±0.5
ดีพอใช้
คะแนนเกณฑ์การเขียน
TA7.0
CC7.0
LR6.0
GRA7.0
คลิกข้อความที่ไฮไลต์ในเรียงความเพื่อดูคำแนะนำรายละเอียดเพื่อพัฒนา
การวิเคราะห์เชิงลึก
Task 1 - Academic Writing
4 tools available
บทความตัวอย่าง - IELTS Writing Task 1
ยังไม่มีบทความตัวอย่าง
กดปุ่มด้านล่างเพื่อวิเคราะห์และสร้างบทความตัวอย่างคุณภาพสูงสำหรับ Task 1