
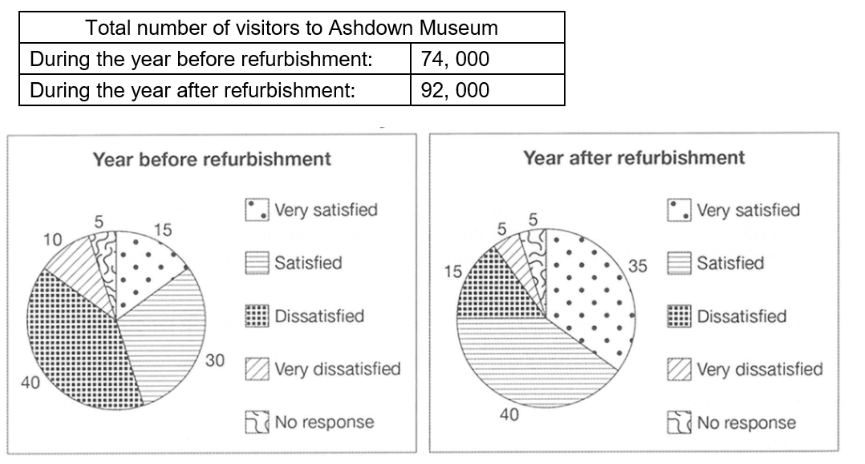
The given table illustrates the total number of visitors to Ashdown Museum during the year before and the year after it was refurbished. The shown pie charts provide the result of the surveys about levels of visitors' satisfaction with their visit, during the same two periods. Overall, Ashdown Museum attracted more visitors after renovation. It is also notable that the proportion of visitors who felt very contented rose significantly, while the share for those who were dissatisfiend dropped. Looking at categories which recorded an increase, the total number of visitors to Ashdown Museum rose from 74 thousand to 92 thousand after its redevelopment. Such a change was accompanied by the climbing rates of satisfaction among visitors: the share for those who were very satisfied rose more than twofold from 15% to 35%, whereas the proportion for visitors who felt satisfied climbed from 30% to 40%. Regarding the remaining categories, the most significant change was the significant drop in the share for dissatisfied visitors, declining from 40% to only 15%. Similarly, after refurbishment, those who were very dissatisfied constituted 5%, which was one-half of the figure recorded before renovation (10%). Meanwhile, the proportion of visitors who gave no response remained constant at 5%.
Sample Detail
The table below shows the numbers of visitors to Ashdown Museum during the year before and the year after it was refurbished. The charts show the result of surveys asking visitors how satisfied they were with their visit, during the same two periods. Summarise the information by selecting and reporting the main features, and make comparisons where relevant
22/07/2026 17:19 7.5 points
Topic
The table below shows the numbers of visitors to Ashdown Museum during the year before and the year after it was refurbished. The charts show the result of surveys asking visitors how satisfied they were with their visit, during the same two periods. Summarise the information by selecting and reporting the main features, and make comparisons where relevant
Word count: 202
Chart/Graph
Essay
Overall Scores
7.5±0.5
Good
Writing Criteria Scores
TA8.0
CC8.0
LR7.0
GRA8.0
Click on any highlighted text in the essay to view detailed suggestions for improvement.
Deep Analysis
Task 1 - Academic Writing
4 tools available
Sample Essay - IELTS Writing Task 1
No sample essay
Click the button below to analyze and generate a high-quality sample essay for Task 1.