
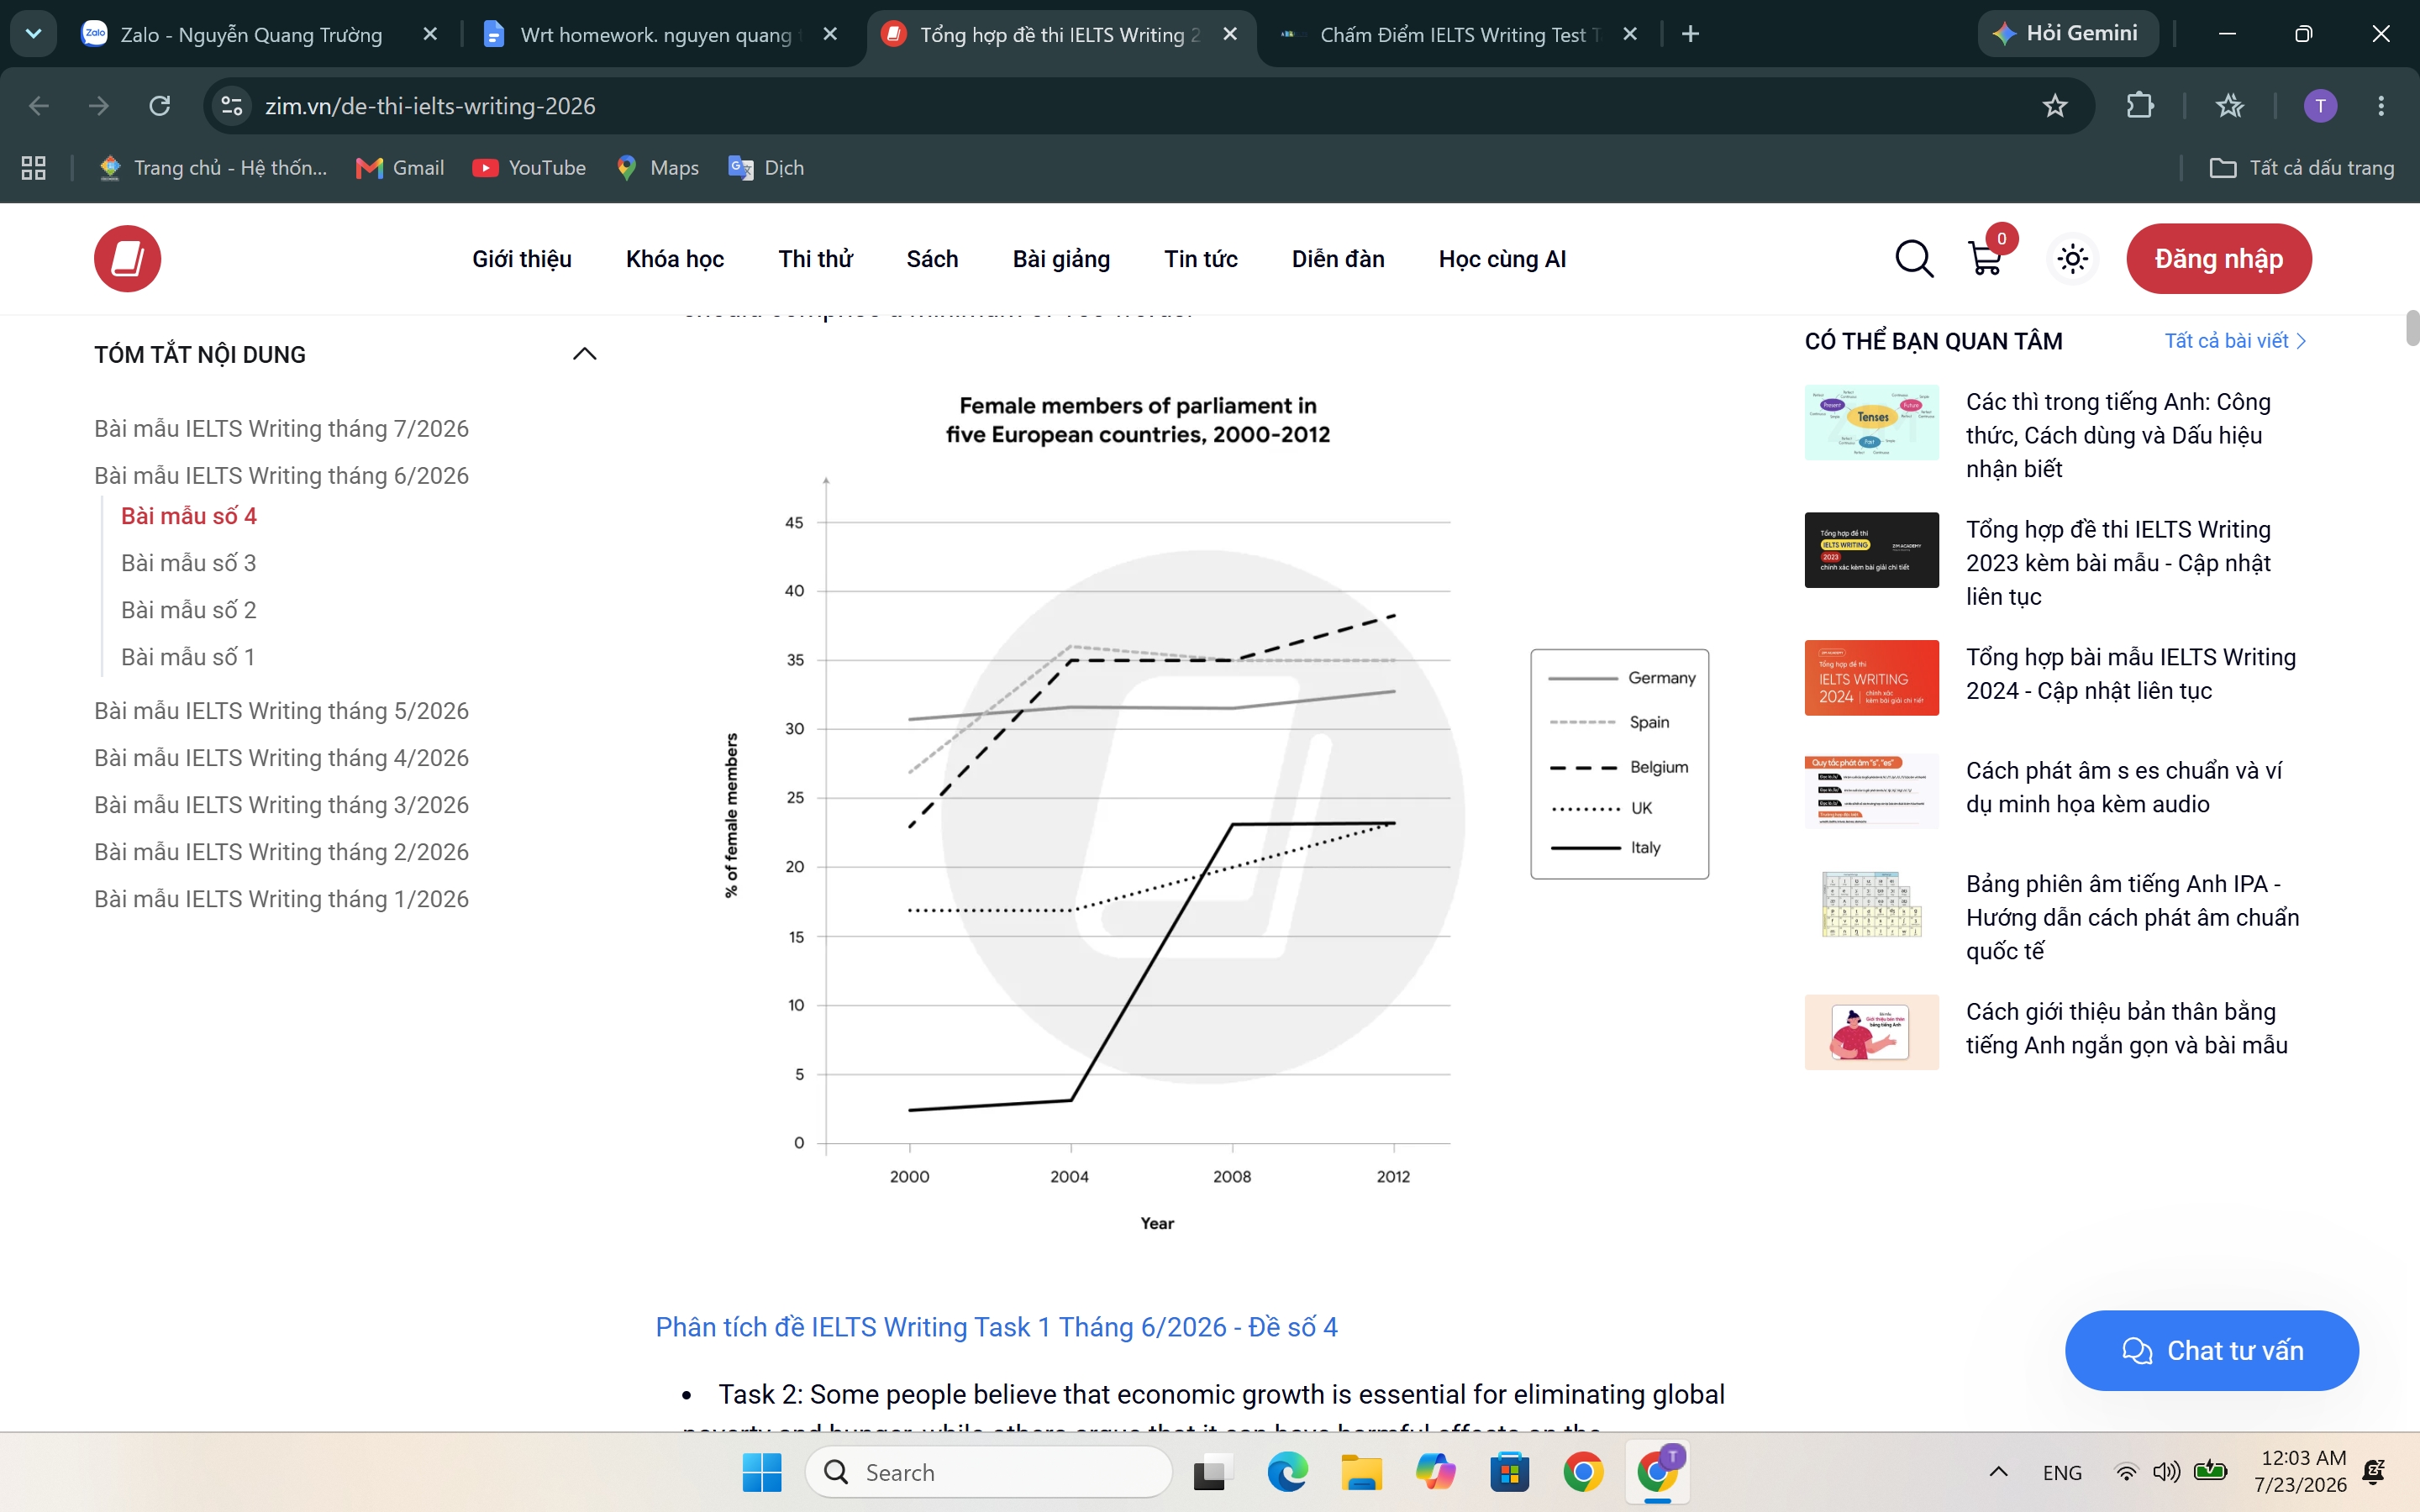
The line chart illustrates the proportion of female members of parliament in Germany, Spain, Belgium, the UK and Italy from 2000 to 2012. Overall, most categories experienced significant upward trends throughout the period, with the exception of Germany, which increased slightly. It is also worth noting that the percentage of female members of parliament in Belgium surpassed that of other countries to become the highest figure on the chart at the end of the period. Looking first at three higher countries, including Germany, Spain and Belgium. Germany was initially the highest figure, at around 31%, after which it ticked up to about 32% in 2004, before remaining relatively stable until 2008 and ending the period at around 33%. In 2000, the percentage of female members of parliament in Spain and Belgium stood at around 27% and 23%, respectively, both of them followed by significant increases and surpassed the figure for Germany in 2004, with the respective figures being 35% and around 36%. However, this order was reversed in following years, as the proportion of women members of parliament in Belgium stayed unchanged in 2008 and sharply rose to around 37% at the end of the period, which was the highest figure on the chart. In contrast, that of Spain slightly edged down to 35% in 2012, which was about 2% lower than Belgium. Turning to the UK and Italy, in 2000, the percentage of female members of parliament in the UK was around 17%, which was far ahead that of Italy, at about 2%. After which the figure for the UK stayed unchanged until 2004, before gradually increasing every 3% each 4 years, it reached around 23% in 2012. Meanwhile, the proportion of women members of parliament in Italy skyrocketed to around 23% in 2008. After that, it stayed intact and crossed the UK at the end of the period.
Sample Detail
Task 1: You have approximately 20 minutes to complete this task. The graph below shows the percentage of female members of parliament in five European countries between 2000 and 2012.Provide an overview of the information by identifying and describing the key details, and include comparisons where appropriate. Your report should comprise a minimum of 150 words.
22/07/2026 17:23 6.5 points
Topic
Task 1: You have approximately 20 minutes to complete this task. The graph below shows the percentage of female members of parliament in five European countries between 2000 and 2012.Provide an overview of the information by identifying and describing the key details, and include comparisons where appropriate. Your report should comprise a minimum of 150 words.
Word count: 310
Chart/Graph
Essay
Overall Scores
6.5±0.5
Fair
Writing Criteria Scores
TA6.0
CC7.0
LR7.0
GRA7.0
Click on any highlighted text in the essay to view detailed suggestions for improvement.
Deep Analysis
Task 1 - Academic Writing
4 tools available
Sample Essay - IELTS Writing Task 1
No sample essay
Click the button below to analyze and generate a high-quality sample essay for Task 1.