
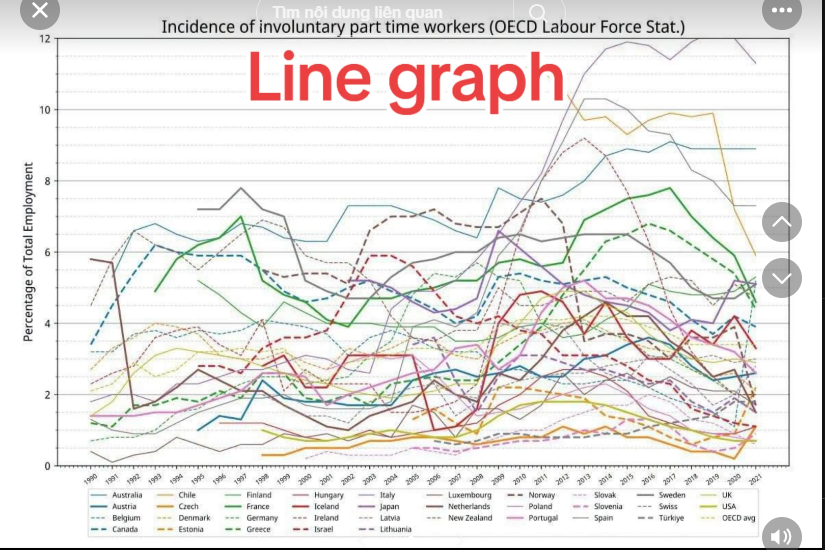
The line graph illustrates the percentage of involuntary part-time workers relative to total employment across various OECD member states between 1990 and 2021. Overall, despite broad variations across individual nations, the general trend was marked by an upward movement following the 2008 economic crisis, before gradually declining toward 2021. Notably, Southern European nations—specifically Italy, Spain, and Greece—recorded the highest proportions overall, reaching unprecedented peaks, while the OECD average remained relatively stable below 6%. In 1990, almost all tracked countries maintained low rates of involuntary part-time employment, generally below 6%. Over the following decade, most nations experienced minor fluctuations within a narrow band of 2% to 6%. However, a few countries began showing noticeable increases earlier than others. For instance, Italy saw its figure climb steadily from around 5.5% in 1990 to over 7% by the mid-1990s, positioning itself among the higher-ranking nations well before the global downturn. The impact of the 2008 financial crisis triggered a sharp surge across nearly all countries. This rise was most dramatic in Spain, Italy, and Greece, where percentages rose steeply between 2008 and 2014. Italy and Spain reached the highest figures in the entire graph, peaking at nearly 12% between 2013 and 2015. Greece followed a remarkably similar trajectory, climbing rapidly from under 5% in 2008 to a high of roughly 8% in the mid-2010s. Post-2014, a broad recovery led to a steady decline in figures for most states. Despite falling sharply after 2015, percentages in top-ranking nations like Spain and Italy remained among the highest in 2021 (around 6% to 11%). Meanwhile, the OECD average mirrored this overall pattern on a lower scale, peaking at approximately 5.5% in 2013–2014 before dropping back below 4% by 2021.
नमूना विवरण
The graph below shows the percentage of involuntary part-time workers relative to total employment in various OECD countries between 1990 and 2021. Summarise the information by selecting and reporting the main features, and make comparisons where relevant.
22/07/2026 17:35 6.5 अंक
विषय
The graph below shows the percentage of involuntary part-time workers relative to total employment in various OECD countries between 1990 and 2021. Summarise the information by selecting and reporting the main features, and make comparisons where relevant.
शब्दों की संख्या: 283
चार्ट/ग्राफ
Essay
समग्र स्कोर
6.5±0.5
ठीक
राइटिंग मानदंड स्कोर
TA5.0
CC7.0
LR7.0
GRA7.0
सुधार के विस्तृत सुझाव देखने के लिए लेख में किसी भी हाइलाइट किए गए टेक्स्ट पर क्लिक करें।
गहन विश्लेषण
Task 1 - Academic Writing
4 उपकरण उपलब्ध
नमूना लेख - IELTS Writing Task 1
कोई नमूना लेख नहीं
Task 1 के लिए उच्च-गुणवत्ता वाला नमूना लेख विश्लेषण और बनाने के लिए नीचे दिए गए बटन पर क्लिक करें।