
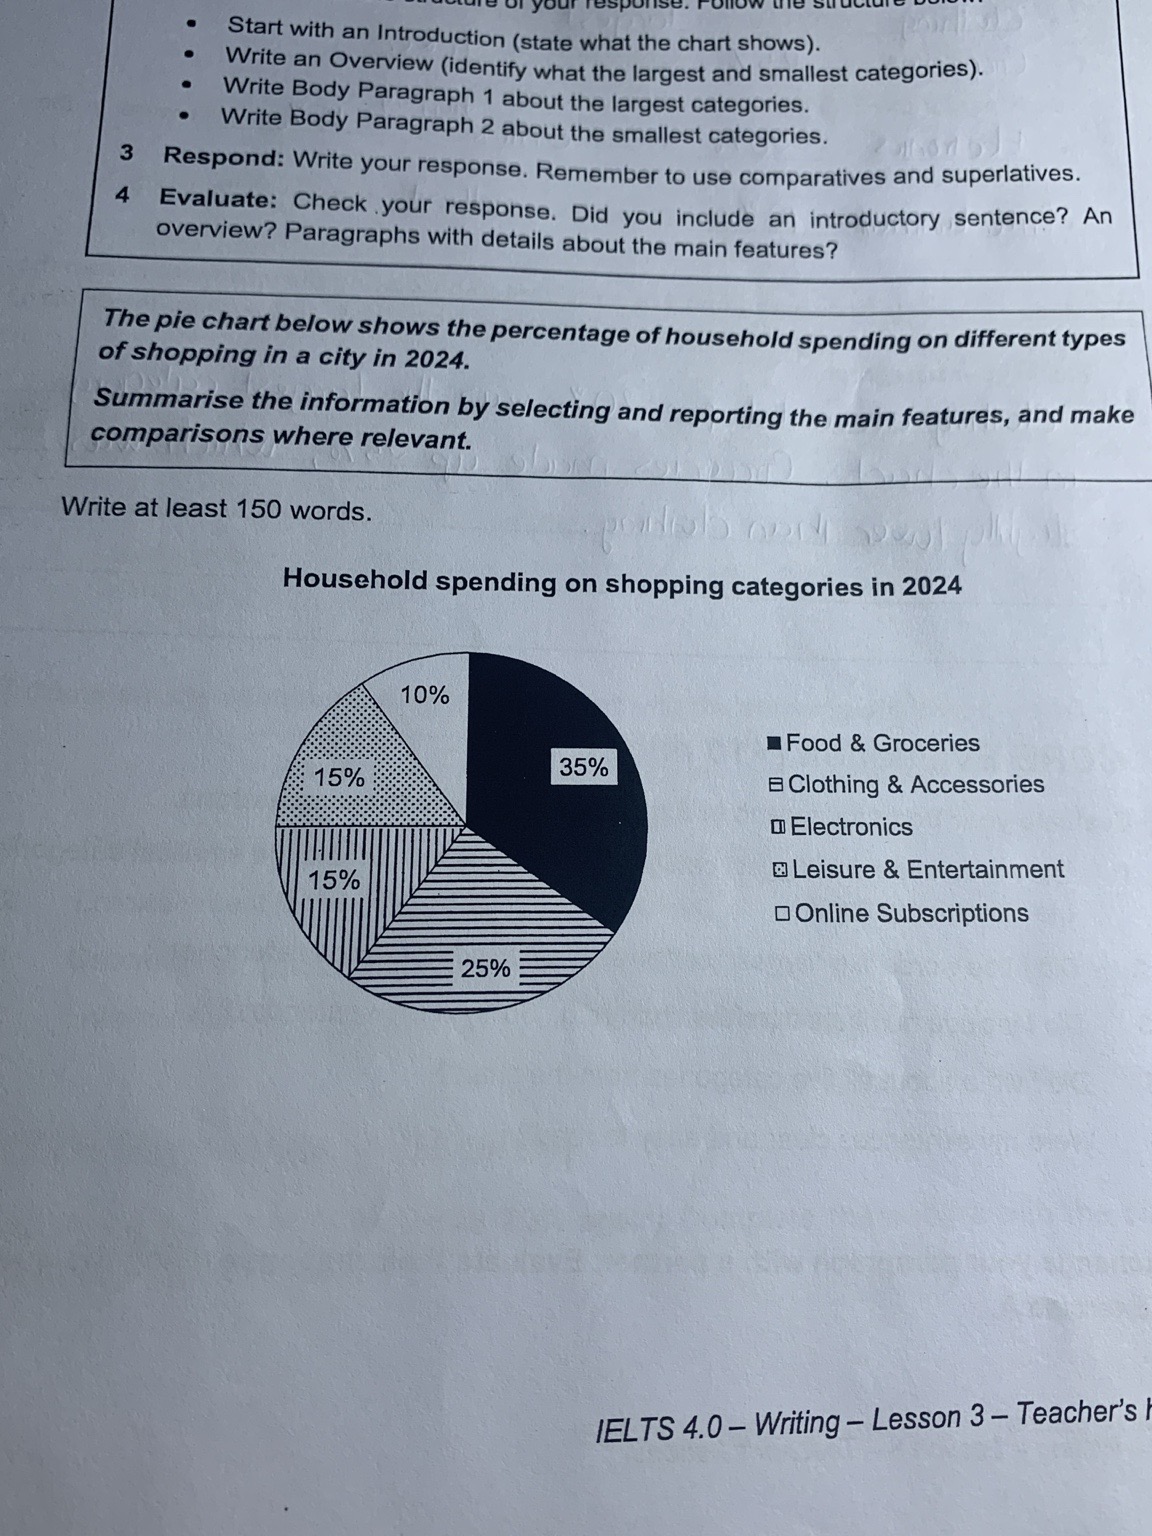
The pie chart illustrates the proportion of household spending on shopping divided into five categories in 2024. Overall, food and groceries have the largest share of the shopping payments, while online subscriptions are the smallest. Looking at the chart in more detail, food and groceries were the most essential items, accounting for 35% of the total. This is followed by clothing and accessories, which is the second biggest figure, accounting for 25%. Together, these two categories made up 60% of the total. By contrast, the smallest segment is online subscriptions, which represent 10% of the household spending on shopping. Leisure and entertainment and electronics accounted for 15% each.
Detail Sampel
The chart below shows sales of three categories of magazines (fashion, music, and sports) in a particular region over five weeks. Summarise the information by selecting and reporting the main features, and make comparisons where relevant.
22/07/2026 17:36 6.0 skor
Topik
The chart below shows sales of three categories of magazines (fashion, music, and sports) in a particular region over five weeks. Summarise the information by selecting and reporting the main features, and make comparisons where relevant.
Jumlah kata: 108
Grafik/Diagram
Essay
Skor Keseluruhan
6.0±0.5
Cukup
Skor Kriteria Writing
TA6.0
CC6.0
LR6.0
GRA6.0
Klik teks yang ditandai di esai untuk melihat saran detail untuk peningkatan.
Analisis mendalam
Task 1 - Academic Writing
4 tools available
Esai contoh - IELTS Writing Task 1
Belum ada esai contoh
Silakan klik tombol di bawah untuk menganalisis dan membuat esai contoh berkualitas tinggi untuk Task 1.