
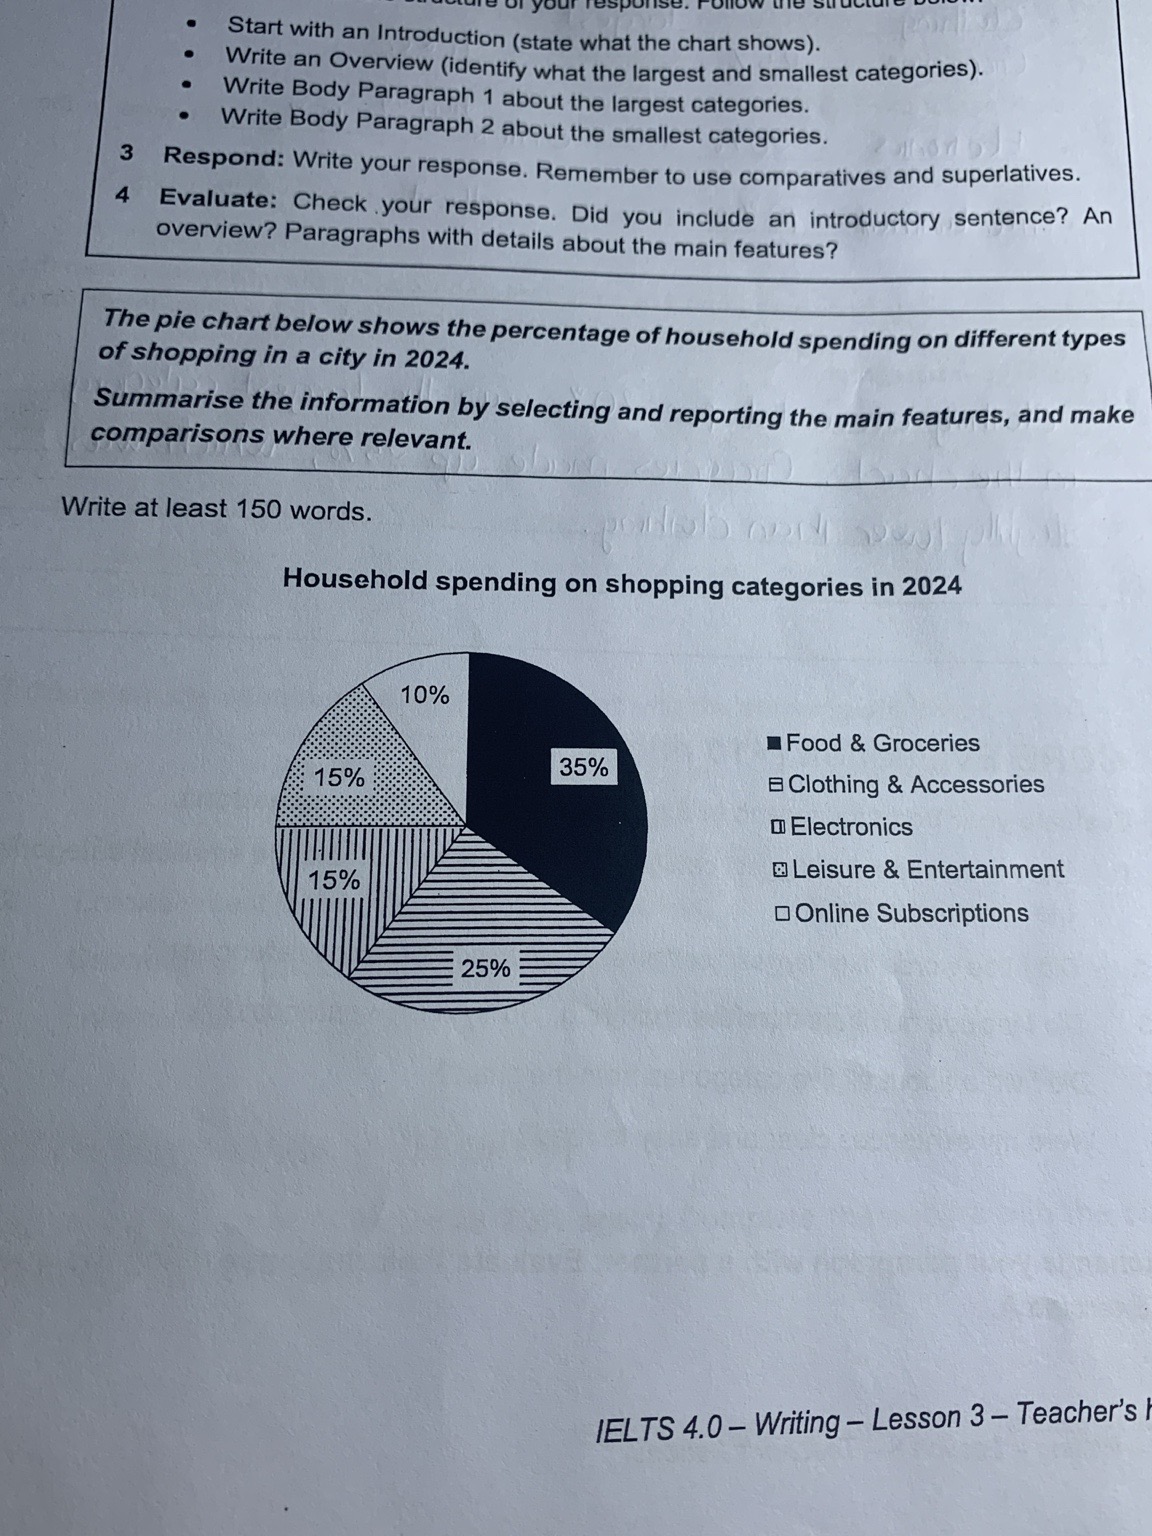
The pie chart illustrates the proportion of household spending on shopping divided into five categories in 2024. Overall, food and groceries have the largest share of the shopping payments, while online subscriptions are the smallest. Looking at the chart in more detail, food and groceries were the most essential items, accounting for 35% of the total. This is followed by clothing and accessories, which is the second biggest figure, accounting for 25%. Together, these two categories made up 60% of the total. By contrast, the smallest segment is online subscriptions, which represent 10% of the household spending on shopping. Leisure and entertainment and electronics accounted for 15% each.
รายละเอียดตัวอย่าง
The chart below shows sales of three categories of magazines (fashion, music, and sports) in a particular region over five weeks. Summarise the information by selecting and reporting the main features, and make comparisons where relevant.
22/07/2026 17:36 6.0 คะแนน
หัวข้อ
The chart below shows sales of three categories of magazines (fashion, music, and sports) in a particular region over five weeks. Summarise the information by selecting and reporting the main features, and make comparisons where relevant.
จำนวนคำ: 108
แผนภูมิ/กราฟ
Essay
คะแนนรวม
6.0±0.5
ดีพอใช้
คะแนนเกณฑ์การเขียน
TA6.0
CC6.0
LR6.0
GRA6.0
คลิกข้อความที่ไฮไลต์ในเรียงความเพื่อดูคำแนะนำรายละเอียดเพื่อพัฒนา
การวิเคราะห์เชิงลึก
Task 1 - Academic Writing
4 tools available
บทความตัวอย่าง - IELTS Writing Task 1
ยังไม่มีบทความตัวอย่าง
กดปุ่มด้านล่างเพื่อวิเคราะห์และสร้างบทความตัวอย่างคุณภาพสูงสำหรับ Task 1