
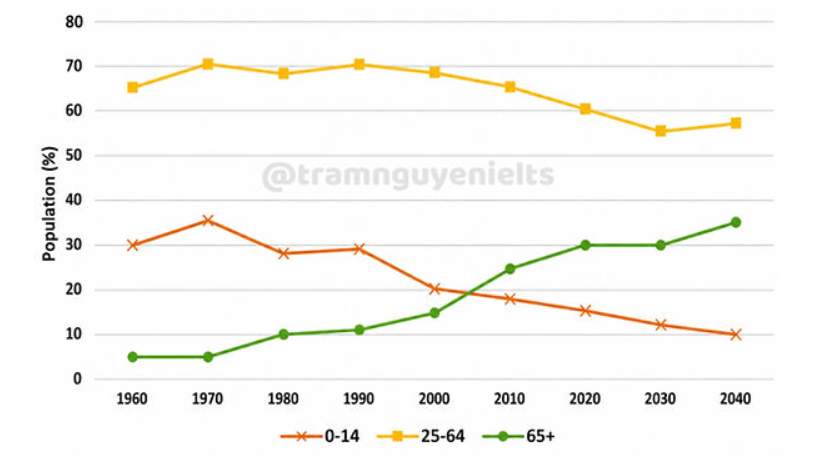
The line graph illustrates the proportions of Japan’s population by three different age groups from 1960 to 2040. Overall, it is observed that while 0-14 and 25-64 age groups have been decreasing, the proportion of the elderly population (65+) has seen a steady increase and is expected to rise. Notably, the 25-64 age group has took the leading position throughout the period. Looking first at the 25-64 age group, it initially made up the highest figure with around 65% before increasing slightly to 70% in 1970. This percentage remained relatively stable for several decades before experiencing a consistent decline and is projected to fall to a minimum of about 56% in 2030, followed by a recovery to 58% in 2040. In a similar pattern, 0-14 age bracket accounted for 30% in 1960 and recorded a significant oscillation in the following 30 years. Subsequently, this age group witnessed a steady decline and is forecasted to plunge to the lowest point at 10% at the end of the period. By contrast, the percentage of the elderly population was smallest in 1960, just under 10%. This figure has experienced a considerable growth since then and is expected to rise sharply in the future. By 2040, it is forecasted to hit a peak of around 35%, substantially surpassing that of 0-14 age bracket.
नमूना विवरण
The chart below shows Japan's population by age groups starting in 1960 and including a forecast to 2040. Summarize the information by selecting and reporting the main features and make comparisons where relevant.
22/07/2026 17:56 7.0 अंक
विषय
The chart below shows Japan's population by age groups starting in 1960 and including a forecast to 2040. Summarize the information by selecting and reporting the main features and make comparisons where relevant.
शब्दों की संख्या: 219
चार्ट/ग्राफ
Essay
समग्र स्कोर
7.0±0.5
अच्छा
राइटिंग मानदंड स्कोर
TA7.0
CC7.0
LR7.0
GRA7.0
सुधार के विस्तृत सुझाव देखने के लिए लेख में किसी भी हाइलाइट किए गए टेक्स्ट पर क्लिक करें।
गहन विश्लेषण
Task 1 - Academic Writing
4 उपकरण उपलब्ध
नमूना लेख - IELTS Writing Task 1
कोई नमूना लेख नहीं
Task 1 के लिए उच्च-गुणवत्ता वाला नमूना लेख विश्लेषण और बनाने के लिए नीचे दिए गए बटन पर क्लिक करें।