
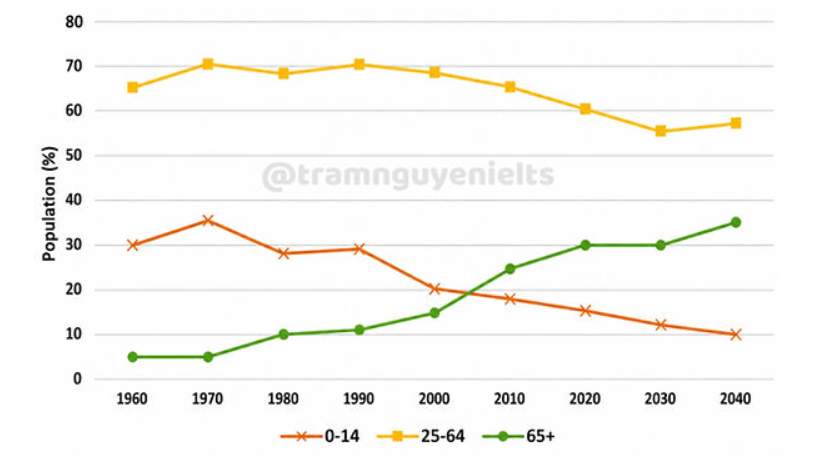
The line graph illustrates the proportions of Japan’s population by three different age groups from 1960 to 2040. Overall, it is observed that while 0-14 and 25-64 age groups have been decreasing, the proportion of the elderly population (65+) has seen a steady increase and is expected to rise. Notably, the 25-64 age group has took the leading position throughout the period. Looking first at the 25-64 age group, it initially made up the highest figure with around 65% before increasing slightly to 70% in 1970. This percentage remained relatively stable for several decades before experiencing a consistent decline and is projected to fall to a minimum of about 56% in 2030, followed by a recovery to 58% in 2040. In a similar pattern, 0-14 age bracket accounted for 30% in 1960 and recorded a significant oscillation in the following 30 years. Subsequently, this age group witnessed a steady decline and is forecasted to plunge to the lowest point at 10% at the end of the period. By contrast, the percentage of the elderly population was smallest in 1960, just under 10%. This figure has experienced a considerable growth since then and is expected to rise sharply in the future. By 2040, it is forecasted to hit a peak of around 35%, substantially surpassing that of 0-14 age bracket.
รายละเอียดตัวอย่าง
The chart below shows Japan's population by age groups starting in 1960 and including a forecast to 2040. Summarize the information by selecting and reporting the main features and make comparisons where relevant.
22/07/2026 17:56 7.0 คะแนน
หัวข้อ
The chart below shows Japan's population by age groups starting in 1960 and including a forecast to 2040. Summarize the information by selecting and reporting the main features and make comparisons where relevant.
จำนวนคำ: 219
แผนภูมิ/กราฟ
Essay
คะแนนรวม
7.0±0.5
ดีมาก
คะแนนเกณฑ์การเขียน
TA7.0
CC7.0
LR7.0
GRA7.0
คลิกข้อความที่ไฮไลต์ในเรียงความเพื่อดูคำแนะนำรายละเอียดเพื่อพัฒนา
การวิเคราะห์เชิงลึก
Task 1 - Academic Writing
4 tools available
บทความตัวอย่าง - IELTS Writing Task 1
ยังไม่มีบทความตัวอย่าง
กดปุ่มด้านล่างเพื่อวิเคราะห์และสร้างบทความตัวอย่างคุณภาพสูงสำหรับ Task 1