
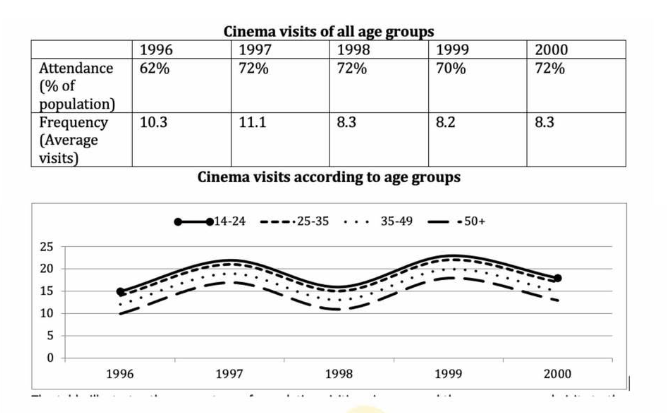
The table and line graph show the percentage of Australians who attended the cinema, the average frequency of cinema visits, and the average number of visits made by different age groups between 1996 and 2000. Overall, cinema attendance remained relatively stable throughout the period, while the average frequency of visits peaked before declining slightly. In addition, all age groups followed a similar pattern of cinema attendance, with people aged 14–24 consistently recording the highest figures and those aged 50 and over the lowest. Looking first at the table, the proportion of people attending the cinema increased from 62% in 1996 to 72% in 1997 and remained at this level in 1998 and 2000, despite a slight fall to 70% in 1999. Meanwhile, the average frequency of visits rose from 10.3 to a peak of 11.1 in 1997 before dropping to just over eight visits in the remaining years. Regarding the line graph, all four age groups experienced a similar trend. Their cinema visits increased in 1997, declined in 1998, reached another peak in 1999, and then fell slightly in 2000. Throughout the period, the youngest group visited the cinema most frequently, whereas the oldest group consistently recorded the lowest figures.
Sample Detail
The table and graph below give information about cinema attendance in Australia between 1994 and 2002.
22/07/2026 17:59 7.0 points
Topic
The table and graph below give information about cinema attendance in Australia between 1994 and 2002.
Word count: 200
Chart/Graph
Essay
Overall Scores
7.0±0.5
Good
Writing Criteria Scores
TA7.0
CC7.0
LR7.0
GRA7.0
Click on any highlighted text in the essay to view detailed suggestions for improvement.
Deep Analysis
Task 1 - Academic Writing
4 tools available
Sample Essay - IELTS Writing Task 1
No sample essay
Click the button below to analyze and generate a high-quality sample essay for Task 1.