
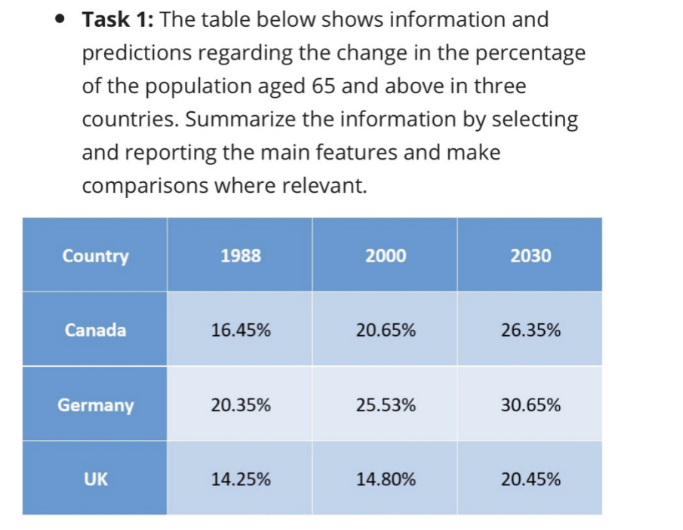
The chart illustrates how many people are 65 years old in three namely countries: Canada, Germany and the UK in 1988, 2000 and 2030. Overall, there are increases in the proportion of the population aged 65 in three countries examined, with Germany consistently having the highest figures throughout the period, while the UK has the youngest population. The percentage of residents aged 65 in Germany and Canada had similar changes between 1998 and 2000, while the figure for Germany increased much more than Canada by just 1%. Meanwhile, the UK saw a slight rise at this time, from 14.25% to 14.80%, which was the lowest extent throughout the period. From 2000 to 2030, the figure for Canada and the UK will likely have a rise of approximately 6%, but a dramatic change is seen in the percentage of people aged 65 in the UK. However, Germany is expected to continue rising similarly to the last period from 25.53 to a peak of 30.65% in the share of population aged 65. It is important to note that Germany has the most inhabitants in this age.
Sample Detail
The table below shows information and predictions regarding the change in the percentage of the population aged 65 and above in three countries. Summarize the information by selecting and reporting the main features and make comparisons where relevant.
22/07/2026 18:16 6.0 points
Topic
The table below shows information and predictions regarding the change in the percentage of the population aged 65 and above in three countries. Summarize the information by selecting and reporting the main features and make comparisons where relevant.
Word count: 184
Chart/Graph
Essay
Overall Scores
6.0±0.5
Fair
Writing Criteria Scores
TA6.0
CC6.0
LR6.0
GRA6.0
Click on any highlighted text in the essay to view detailed suggestions for improvement.
Deep Analysis
Task 1 - Academic Writing
4 tools available
Sample Essay - IELTS Writing Task 1
No sample essay
Click the button below to analyze and generate a high-quality sample essay for Task 1.