
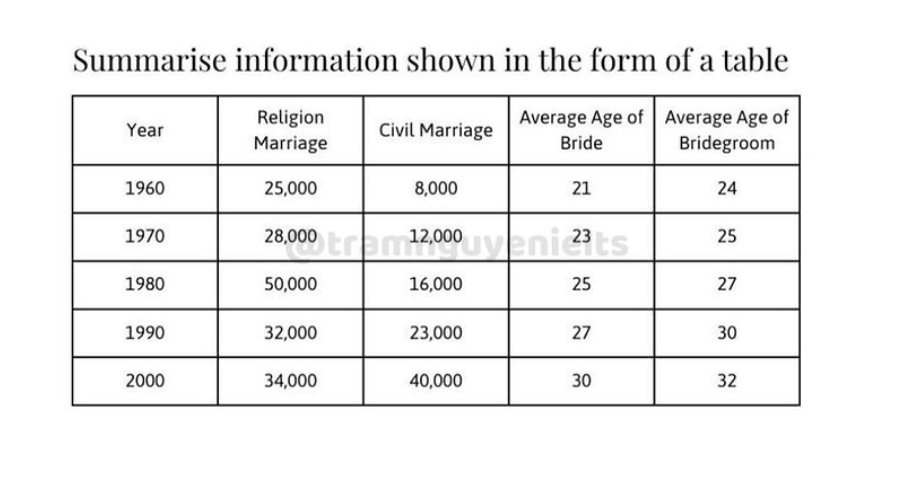
The table illustrates marital status and age between 1960 and 2000 in Australia. Overall, religious marriage tends to decrease, while civil marriage always increases over the years. Meanwhile, the average age of bride and bridegroom shows no signs of decline. To begin with, in 1960, religious marriage stood at 25,000, gradually increased and reached a peak of 50,000 in 1980. However, it began to decline after 10 years, to 32,000. Then, it grew slightly to 34,000 in 2000. The number of civil marriages began with 8,000, after that, it doubled in 1980, with 16,000. Moreover, this figure sharply increased to 40,000 in 2000. Next, begging of the average age of the bride is 21, it gradually rose through the years and reached 30 in 2000. For the average age of bridegroom, this figure comprised 24, it continued to jump in 2000, with 32. The average age of the bridegroom tends to increase faster than the average age of the bride.
নমুনা বিস্তারিত
The table below gives information about the situation of marriage and age from 1960 to 2000 in Australia. Summarise the information by selecting and reporting the main features, and make comparisons where relevant.
22/07/2026 18:28 5.5 স্কোর
টপিক বা বিষয়
The table below gives information about the situation of marriage and age from 1960 to 2000 in Australia. Summarise the information by selecting and reporting the main features, and make comparisons where relevant.
শব্দ সংখ্যা: 160
চার্ট/গ্রাফ
Essay
সামগ্রিক স্কোর
5.5±0.5
প্রাথমিক
রাইটিং মানদণ্ড স্কোর
TA6.0
CC6.0
LR5.0
GRA6.0
উন্নতির জন্য বিস্তারিত পরামর্শ দেখতে প্রবন্ধের হাইলাইট করা যেকোনো লেখায় ক্লিক করুন।
গভীর বিশ্লেষণ
Task 1 - Academic Writing
4 tools available
নমুনা রচনা - IELTS Writing Task 1
কোনো নমুনা রচনা নেই
টাস্ক ১-এর জন্য উচ্চমানের নমুনা রচনা বিশ্লেষণ এবং তৈরি করতে নিচের বাটনে ক্লিক করুন।