
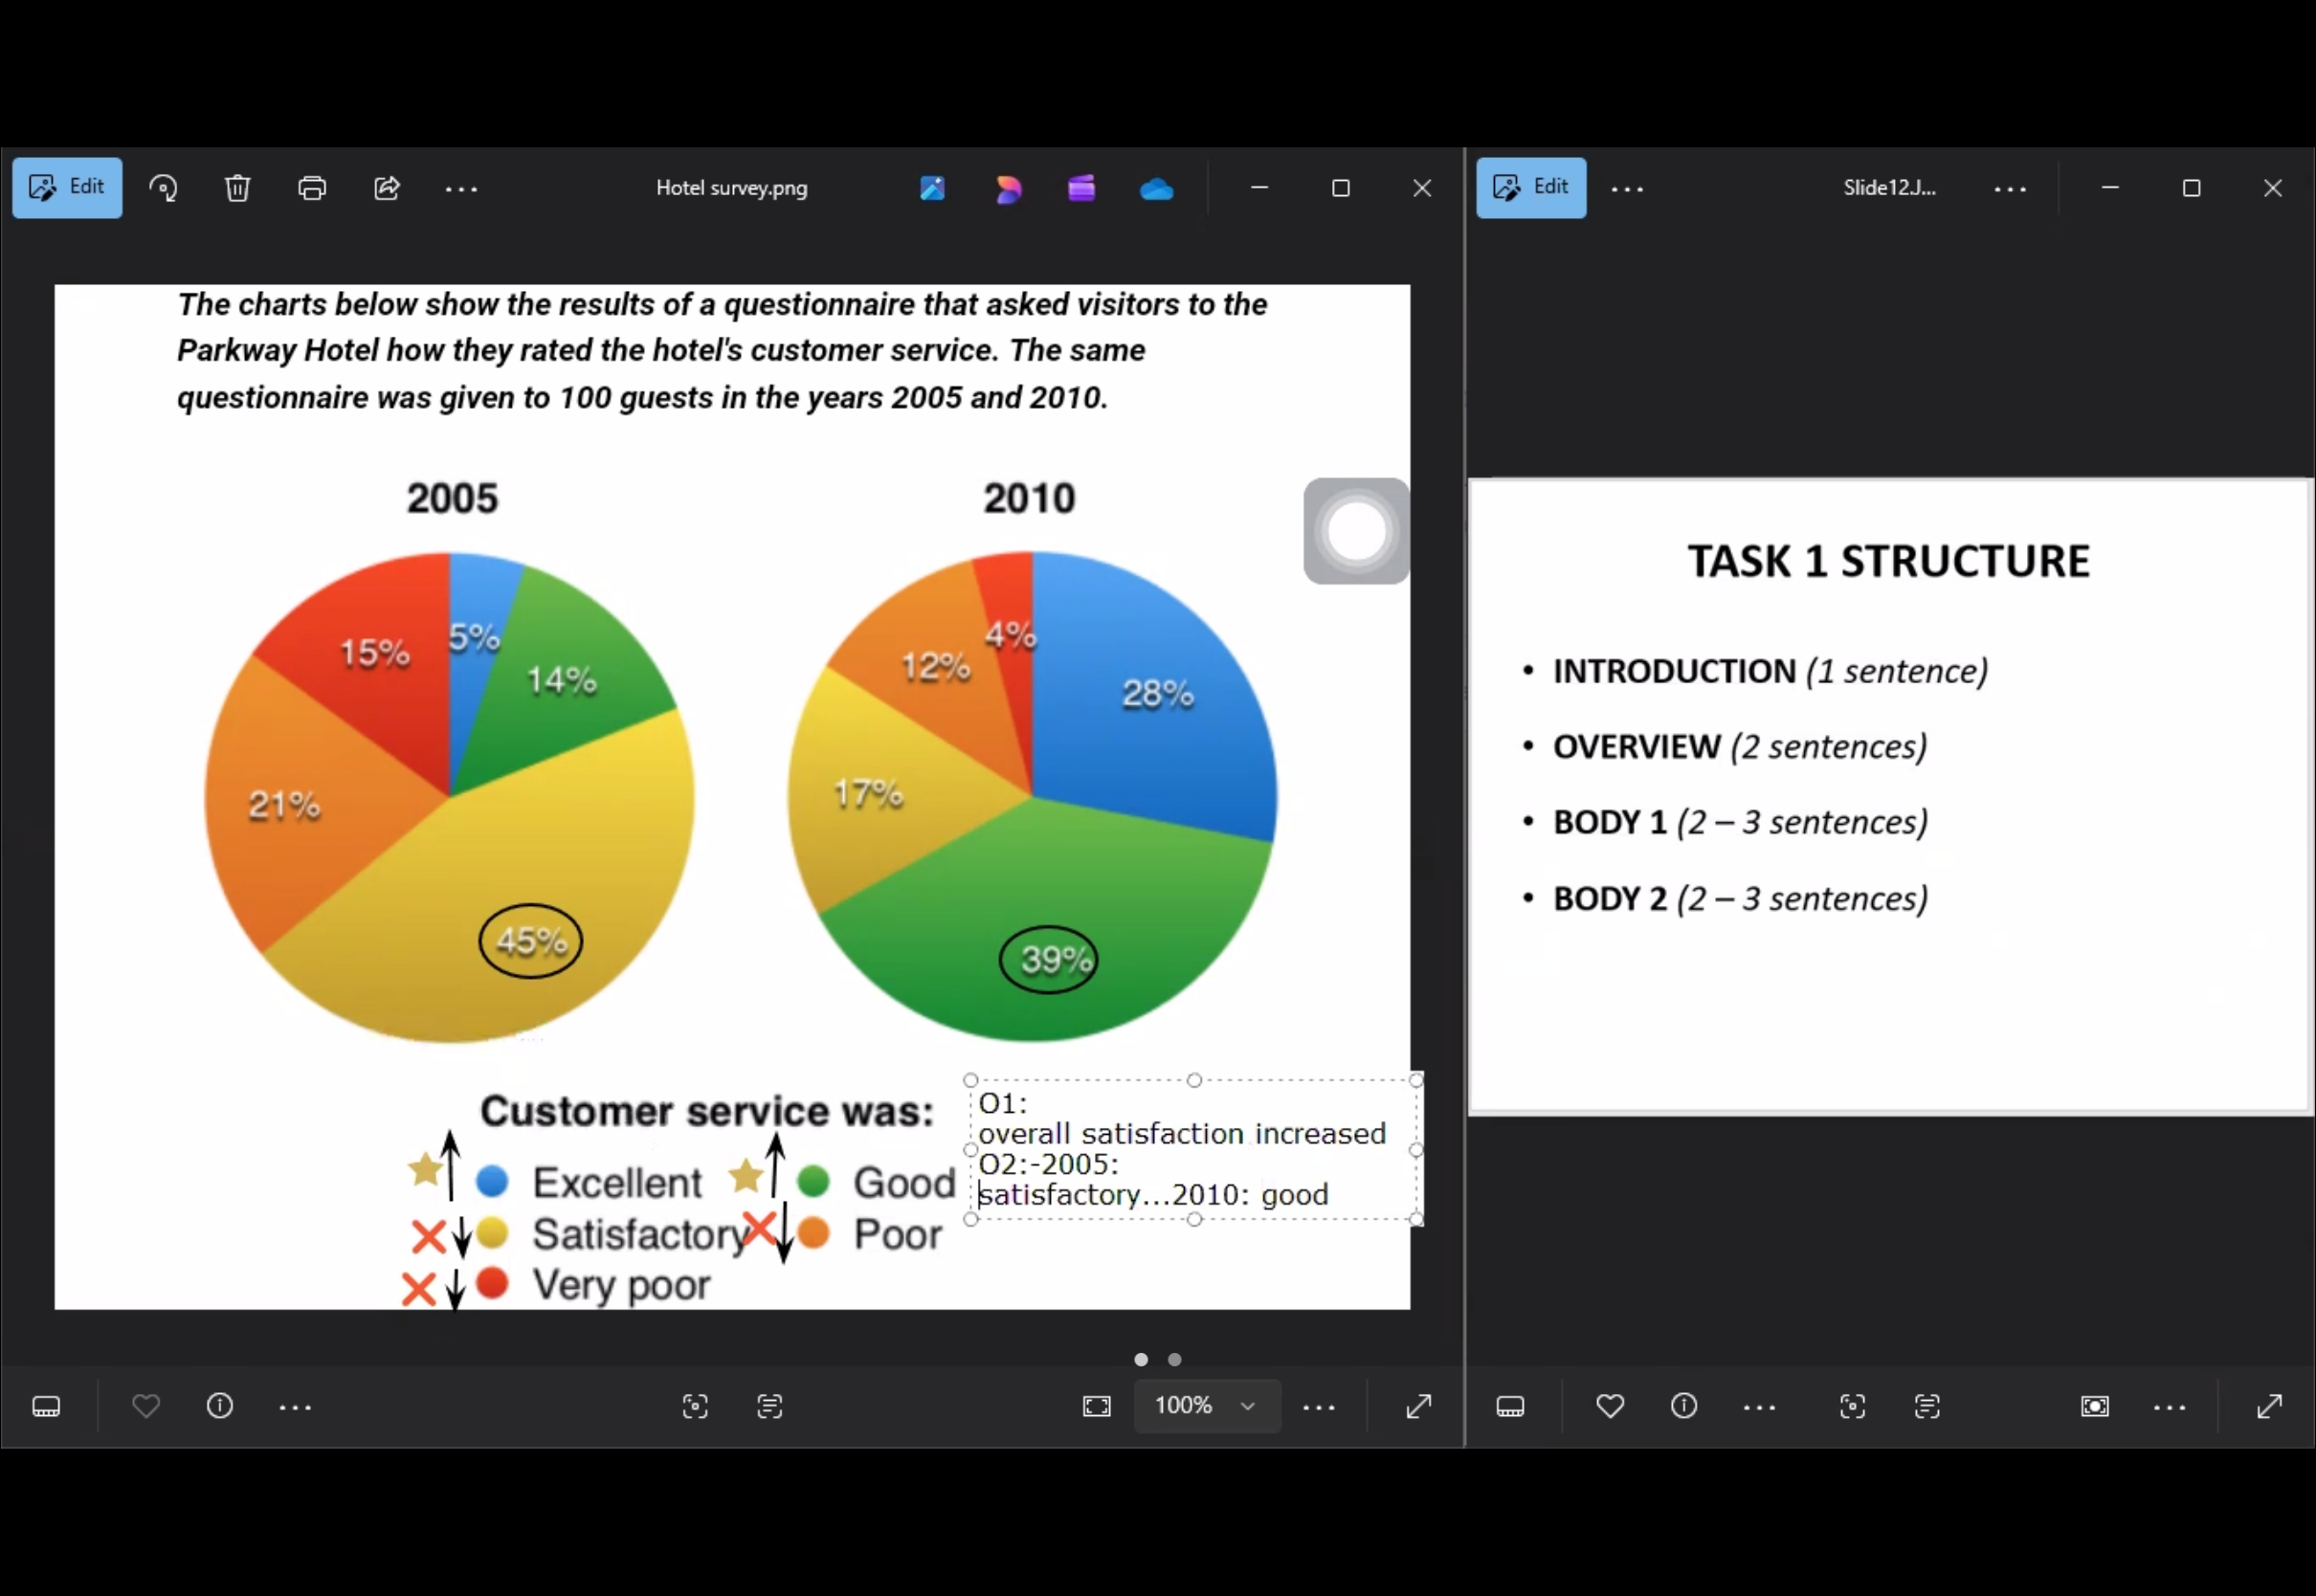
The pie charts illustrate the results of a survey of how 100 guests rated customer service in the Parkway Hotel in two different years. It can be seen that the overall feedback was more positive in 2010 than in 2005. While ‘satisfactory’ was the most popular response in 2005, the ‘good’ review became dominant in five years later. Regarding the positive ratings, the percentage of guests who rated the hotel’s customer service good increased dramatically from 14% in 2005 to 39% in 2010. Likewise, the proportion of visitors giving an ‘excellent’ also rose significantly from just 5% to 28% over the same period. Turning to the negative reviews, hotel’s service was improving overall, with the proportions of bad feedback fallinf substantially .The ‘’satisfactory’ dropped by 28% ,occupied 17% in 2010. In 2005, 21% of the guests had rating the hotel’s care poor, followed by ‘very poor’ 15% were relatively lower, at 12% and 4% in 2010
รายละเอียดตัวอย่าง
The charts below show the results of a questionnaire that asked visitors to the Parkway Hotel how they rated the hotel's customer service. The same questionnaire was given to 100 guests in the years 2005 and 2010.
22/07/2026 18:35 5.5 คะแนน
หัวข้อ
The charts below show the results of a questionnaire that asked visitors to the Parkway Hotel how they rated the hotel's customer service. The same questionnaire was given to 100 guests in the years 2005 and 2010.
จำนวนคำ: 156
แผนภูมิ/กราฟ
Essay
คะแนนรวม
5.5±0.5
พื้นฐาน
คะแนนเกณฑ์การเขียน
TA6.0
CC6.0
LR6.0
GRA5.0
คลิกข้อความที่ไฮไลต์ในเรียงความเพื่อดูคำแนะนำรายละเอียดเพื่อพัฒนา
การวิเคราะห์เชิงลึก
Task 1 - Academic Writing
4 tools available
บทความตัวอย่าง - IELTS Writing Task 1
ยังไม่มีบทความตัวอย่าง
กดปุ่มด้านล่างเพื่อวิเคราะห์และสร้างบทความตัวอย่างคุณภาพสูงสำหรับ Task 1