
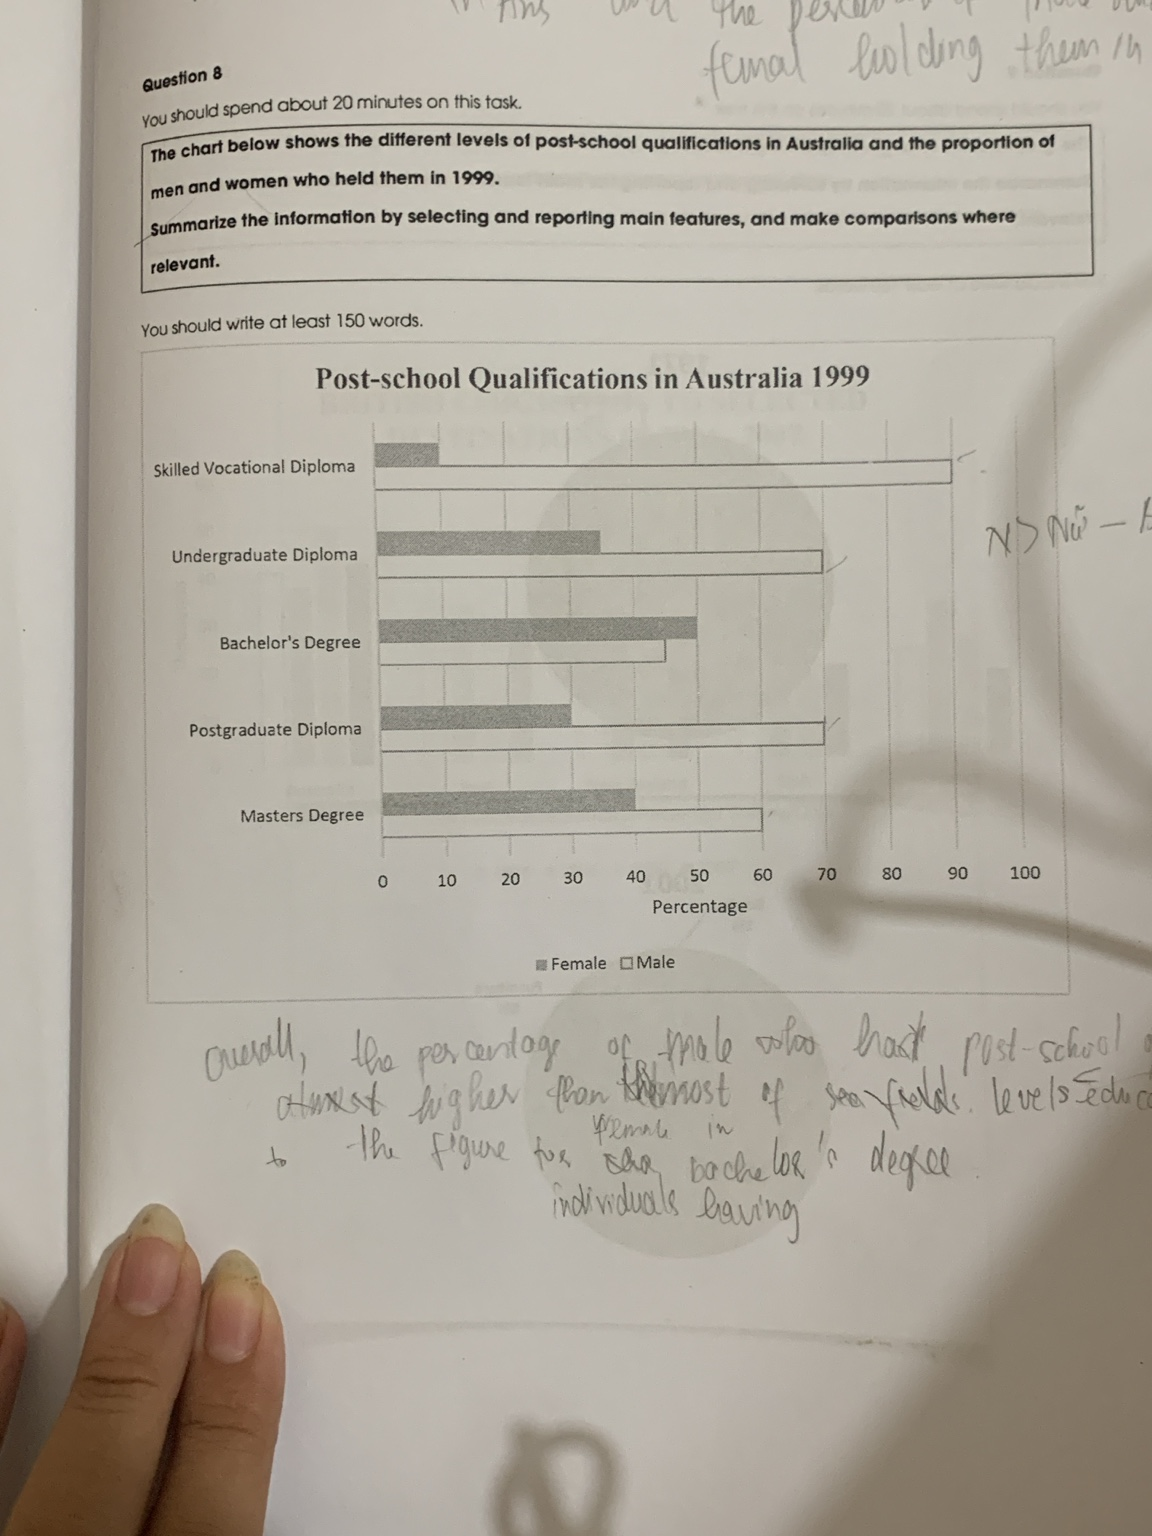
The bar chart compares the percentage of males and females who had different levels of post-school qualification in Autralia in 1999. Overall, the propertion of men having post-school qualification was higher than women in almost of education levels while the figure for bachelor’s degree of females had a larger percentage. In particular, the porportion of men having skilled vocational diploma recorded 90%, being higher as nine times as the figure for those of women and created a biggest gap among the different education levels. Beside, there were less females followed the undergraduate diploma and postgraduate diploma than males. In boths education levels, the percentage of men stood at 70% which almost doubled those of women with about 35% individuals held undergraduate diploma and 30% having postgraduate diploma. In addition, the percentage of male held the master degree also made up 60% which 20% higher than this figure for females. Despite the dominance in almost post-school qualification levels of men, the propertion of women who held bachelor’ degree was higher than this figure for men. The number of females having this qualification reached the highest point at a half while the value for men was the lowest point witnessing 45%.
Sample Detail
The chart below shows the different levels of post-school qualifications in Australia and the proportion of men and women who held them in 1999.
22/07/2026 18:41 6.0 points
Topic
The chart below shows the different levels of post-school qualifications in Australia and the proportion of men and women who held them in 1999.
Word count: 199
Chart/Graph
Essay
Overall Scores
6.0±0.5
Fair
Writing Criteria Scores
TA6.0
CC6.0
LR6.0
GRA6.0
Click on any highlighted text in the essay to view detailed suggestions for improvement.
Deep Analysis
Task 1 - Academic Writing
4 tools available
Sample Essay - IELTS Writing Task 1
No sample essay
Click the button below to analyze and generate a high-quality sample essay for Task 1.