
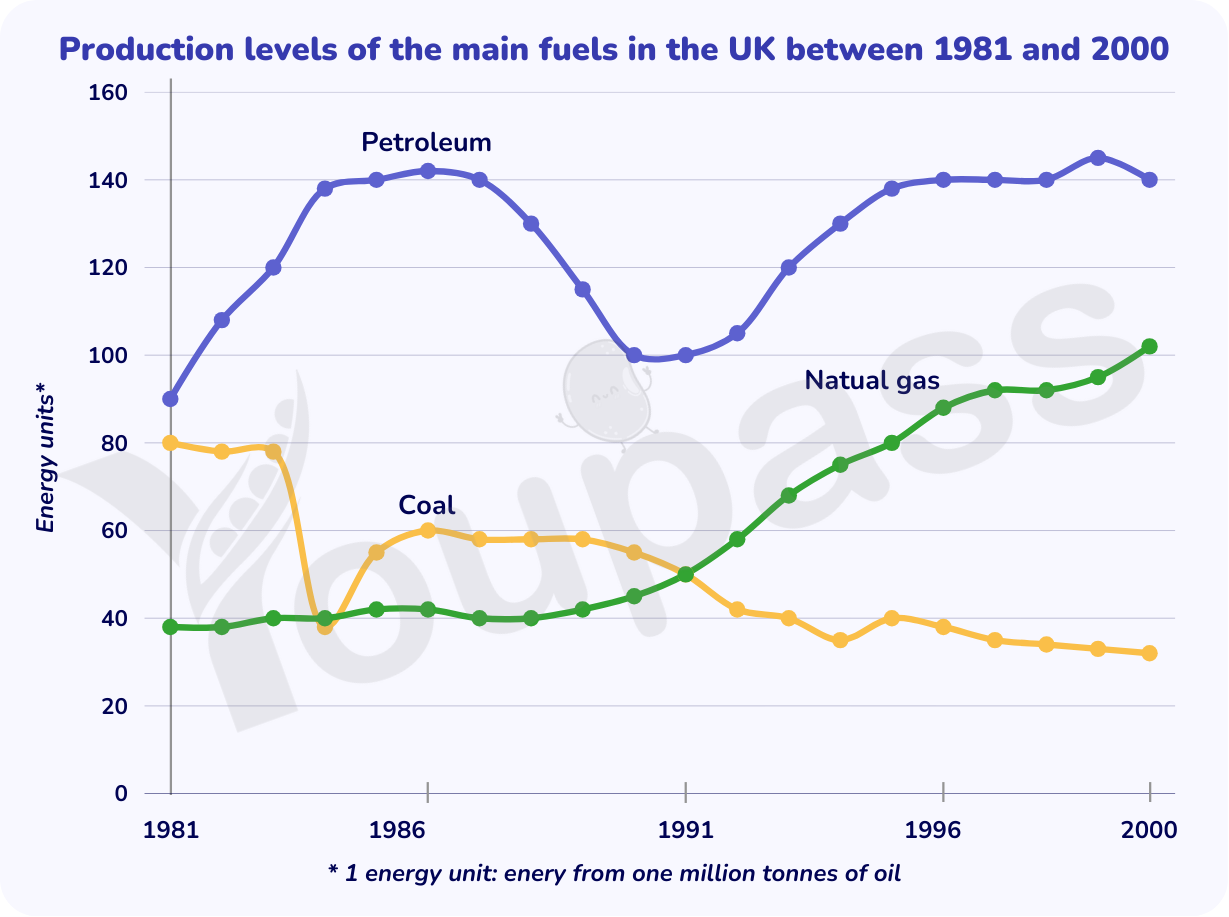
The line chart illustrates the production levels of Petroleum, Coal and Natural gas in the UK in a nineteen-year period from 1981 to 2000 Overall, the data for petroleum registered the highest level over the period, while that for natural gas showed the lowest value at the beginning of the given timeframe. Notably, the figures for petroleum and natural gas rose thoughout the period, while a reverse trend was true for coal, with natural gas recording the most substantial growth trajectory Regarding the quantity of petroleum produced, petroleum represented the most common type of fuel at the beginning of the period, accounting for approximately 90 million tones. After that, the data for petroleum then surged substantially to roughly 140 million tones in 1986, before falling steeply to nearly 100 million tones in 1991. Subsequently, it rebounded significantly and reached a peak of nearly 145 million tones by the end of the period, making it the highest value among all categories. By contrast, the statistic for natural gas exhibited a more even pattern, with about 40 million tones being produced in 1981, after which it experienced a plateau in the next five years, before rising gradually and converging with the figure for coal in 1991 at approximately 50 million tonnes. Following this, it climbed consistently until the end, reaching roughly 100 million tonnes. Despite being the lowest value at the beginning of the period, it surpassed the data for coal and became the largest level by the end of the given timeframe. As for the production level of coal, the quantity of coal being produced constituted the second highest value at nearly 80 million tonnes in 1981. it then plummeted dramatically and recovered to roughly 60 million tonnes in 1986, before remaining unchanged in the next five years. Subsequently, it declined steadily to about 40 million tonnes in 1996 and ended at approximately 30 million tonnes, losing its initial raking position.
รายละเอียดตัวอย่าง
The graph below shows the production levels of the main kinds of fuel in the UK between 1981 and 2000. Summarize the formation by selecting and reporting the main features and make comparisons where relevant.
22/07/2026 18:47 7.5 คะแนน
หัวข้อ
The graph below shows the production levels of the main kinds of fuel in the UK between 1981 and 2000. Summarize the formation by selecting and reporting the main features and make comparisons where relevant.
จำนวนคำ: 320
แผนภูมิ/กราฟ
Essay
คะแนนรวม
7.5±0.5
ดีมาก
คะแนนเกณฑ์การเขียน
TA8.0
CC8.0
LR7.0
GRA7.0
คลิกข้อความที่ไฮไลต์ในเรียงความเพื่อดูคำแนะนำรายละเอียดเพื่อพัฒนา
การวิเคราะห์เชิงลึก
Task 1 - Academic Writing
4 tools available
บทความตัวอย่าง - IELTS Writing Task 1
ยังไม่มีบทความตัวอย่าง
กดปุ่มด้านล่างเพื่อวิเคราะห์และสร้างบทความตัวอย่างคุณภาพสูงสำหรับ Task 1